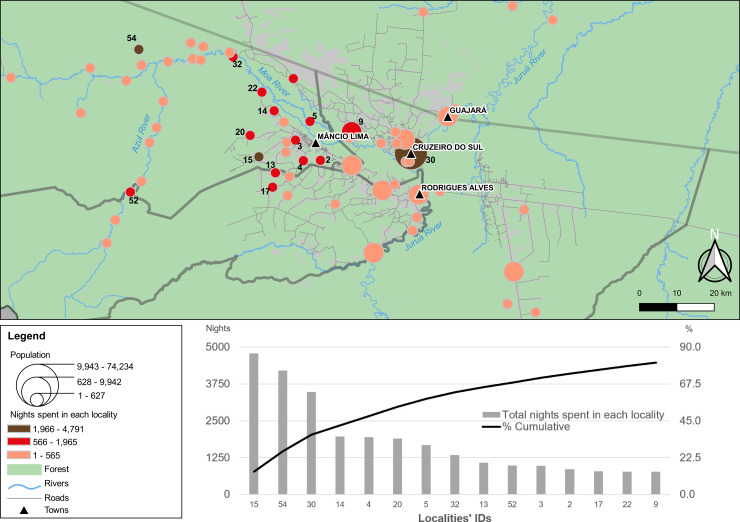
Fig 4. Trip destinations of residents in the town of Mâncio Lima according to number of overnight stays.
As in Fig 1, the map shows the location of the town of Mâncio Lima and the 65 localities in the upper Juruá Valley region with overnigths reported by study participants. Georeferenced localities are represented by circles with size proportional to their population size and filled with tones from light orange to dark brown that are proportional to the number of overnights in each locality between September 2018 and August 2019 (larger number of overnights in darker tones). The lower panel shows the cumulative number and proportion of overnights in the top-15 localities; their identification codes (IDs) are shown in the map.

