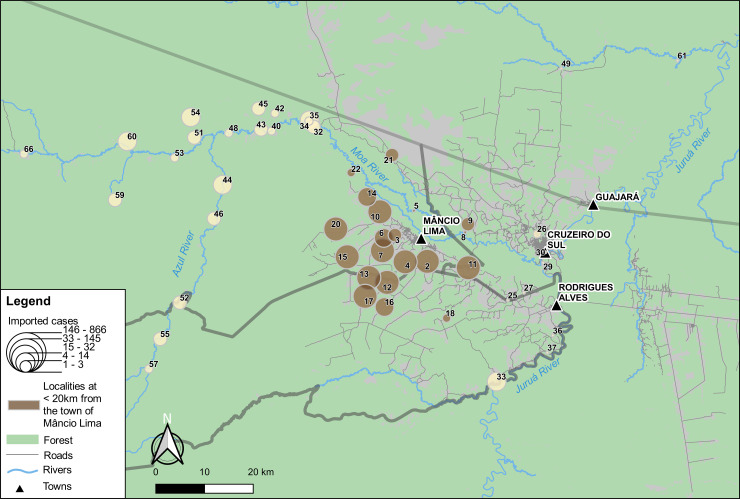
Fig 5. Map showing the localities recorded as source of imported malaria cases diagnosed and treated in Mâncio Lima between 2016 and 2018.
Localities are represented by circles with size proportional to the total number of malaria cases acquired in each locality that were diagnosed and treated in the town of Mâncio Lima between 2016 and 2018 (quintiles). Localities situated at < 20km from the town (Euclidian distance) are shown in bown. The numbers of infections per locality that were imported to the town are shown in S8 Table.

