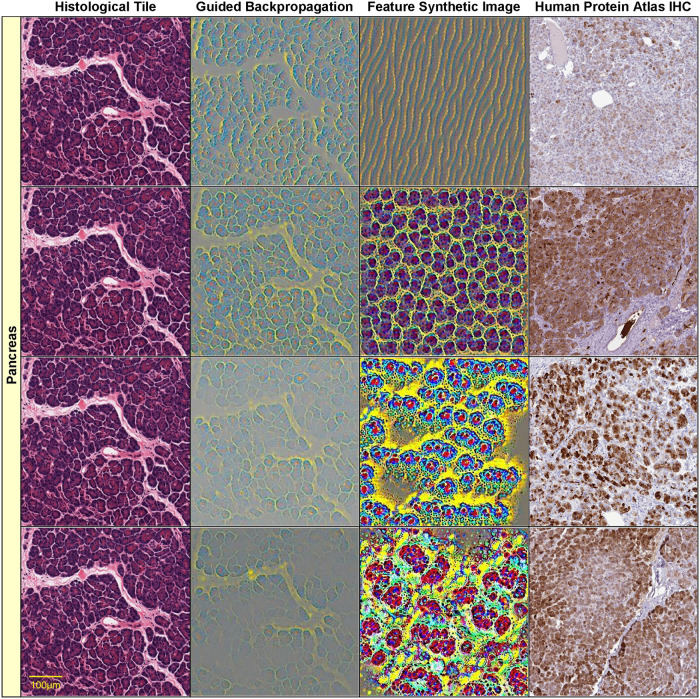
Fig 4. Visualizations of select histological features.
The following features (of the form [layer]_[channel]) found correlated with specific genes are visualized on each row: row 1: 8_55—CTRC (r = 0.85), row 2: 18_13—CUZD1 (r = 0.866), row 3: 23_324—CELA3B (r = 0.868), row 4: 30_467—AMY2A (r = 0.928). Original image (column 1), guided backpropagation of the feature on the original image (column 2), synthetic image of the feature (column 3), immunohistochemistry image for the corresponding gene from the Human Protein Atlas (column 4). All visualizations are for pancreas sample tile GTEX-11NSD-0526_32_5.

