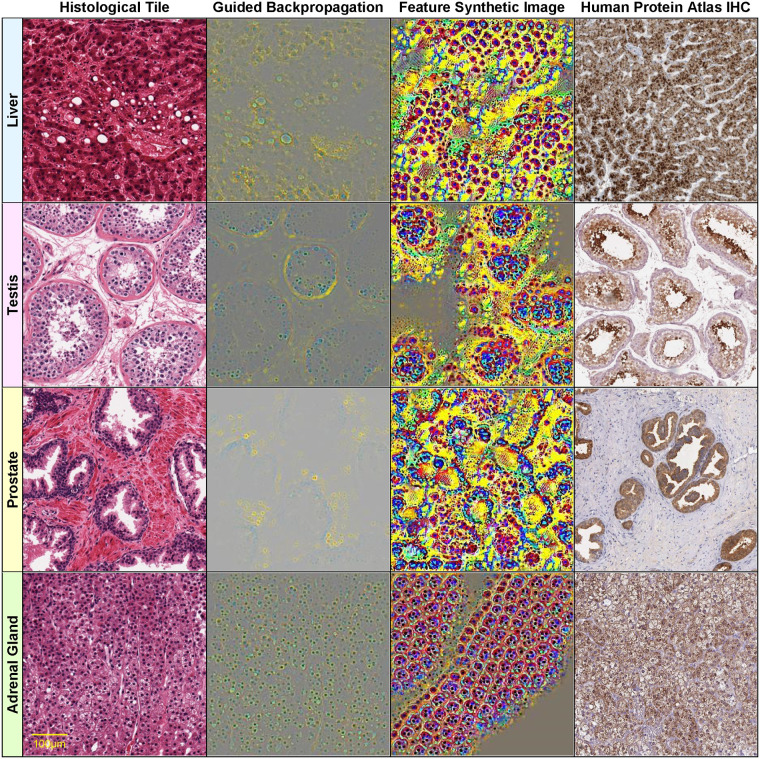
Fig 6. Visualizations of select histological features.
The following features (of the form [layer]_[channel]) found correlated with specific genes are visualized on each row: row 1: 29_234 AGXT (r = 0.939) Liver GTEX-Q2AG-1126_9_7, row 2: 29_118 CALR3 (r = 0.829) Testis GTEX-11NSD-1026_5_27, row 3: 30_244 KLK3 (r = 0.828) Prostate GTEX-V955-1826_8_13, row 4: 20_137 CYP11B1 (r = 0.850) Adrenal Gland GTEX-QLQW-0226_25_9. Original image (column 1), guided backpropagation of the feature on the original image (column 2), synthetic image of the feature (column 3), immunohistochemistry image for the corresponding gene from the Human Protein Atlas (column 4).

