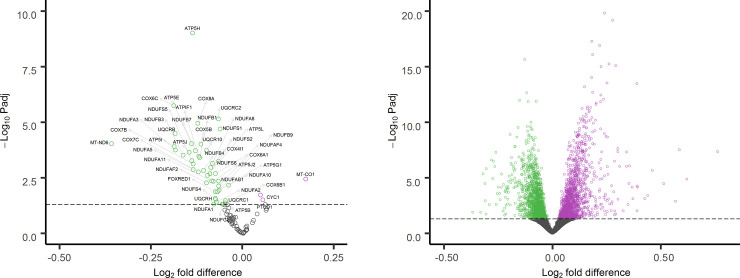
Fig 2. Volcano plots of gene expression differences for SAPPHIRE participants with asthma (n = 197) as compared with participants without asthma (n = 419).
Plot A presents expression differences for 100 electron transport chain (ETC) genes derived from RNA-seq of whole blood. Plot B presents expression differences for 18,484 protein-encoding genes not involved in the ETC from the same participant samples. Genes with significantly higher expression in individuals with asthma are shown in purple; genes with significantly lower expression are shown in green; and genes whose expression does not differ significantly between individuals with and without asthma are shown in gray.

