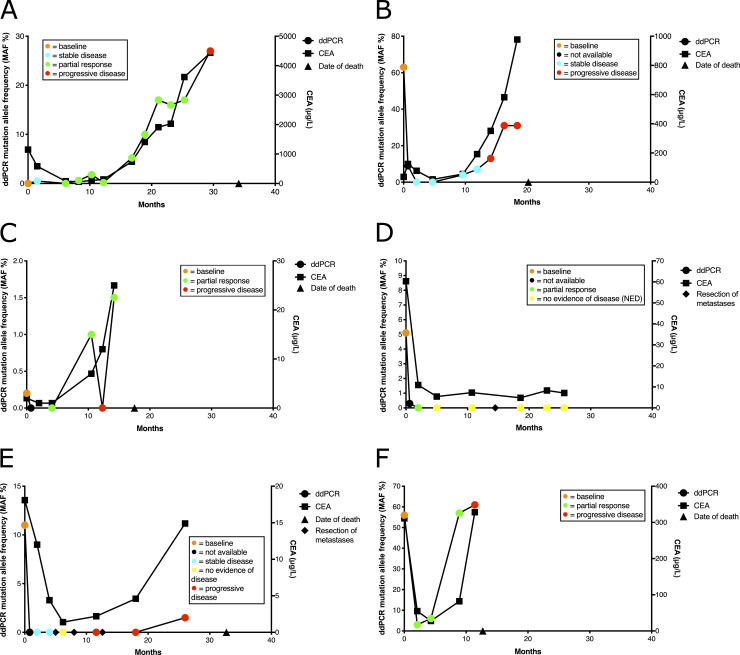
Fig 1. DdPCR KRAS mutation allele frequency (MAF) of serial plasma samples, RECIST evaluation, and CEA values of six patients.
DdPCR MAF values (%) are shown on the left y-axis and CEA measurements on the right y-axis for patients #1 (A), #4 (B), #5 (C), #6 (D), #8 (E), and #10 (F). Baseline is depicted by orange circles (0 day time point) and RECIST evaluation of stable disease by blue, partial response by green, progressive disease by red, and no evidence of disease by yellow. CEA values are depicted with solid squares. The triangle on the x-axis indicates the time of death. The rhombuses on the x-axes Fig 1D and 1E) indicate the resection of liver metastases. Patient #6 (Fig 1D) is the only long-term survivor in the cohort.

