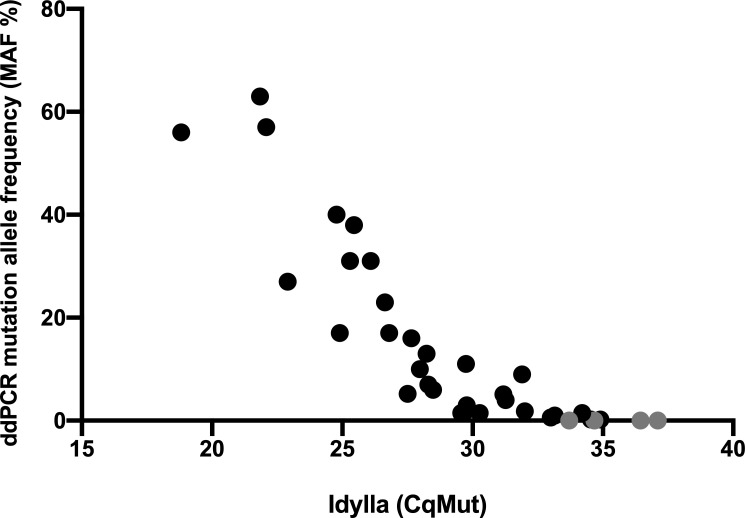
Fig 3. Concordance in KRAS mutation status between ddPCR and Idylla.
Mutations in KRAS codons 12 or 13 were analyzed from the plasma samples (n = 60) of nine mCRC patients. CfDNA was extracted from 2 ml of plasma for ddPCR analysis, while proteinase K-treated plasma (1 ml) was analyzed using Idylla. Four Idylla-positive samples gave a zero value when analyzed by ddPCR (marked in gray). Two samples gave an invalid result when analyzed by Idylla and are not depicted in the graph. The Spearman correlation coefficient between ddPCR and Idylla CqMut values was -0.9461 (95% CI -0.9732 –-0.8930, p < 0.0001), showing a strong inverse correlation between ddPCR MAF values and Idylla CqMut values.

