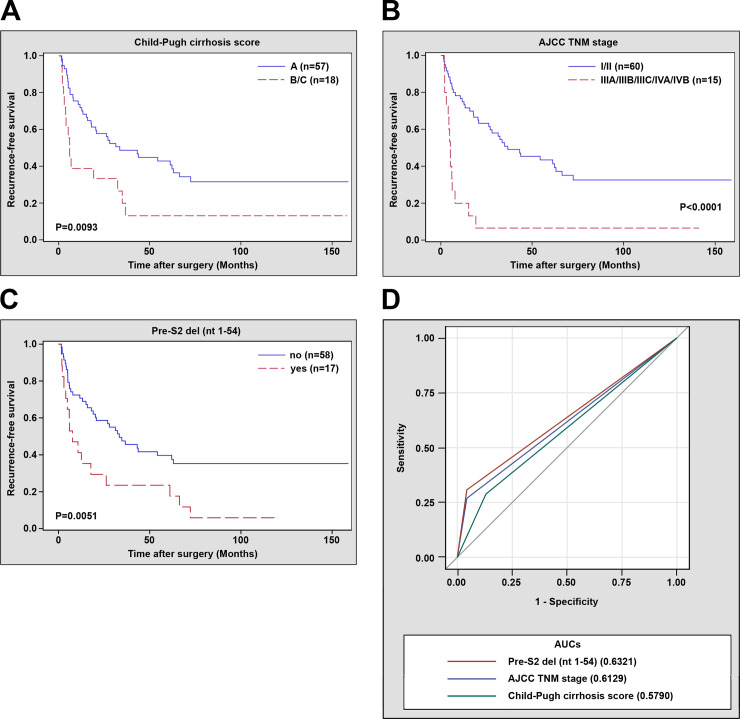
Fig 2. RFS and ROC curves in 75 HBV-related HCC patients receiving curative surgical resection.
RFS curves in patients with Child-Pugh cirrhosis score B/C versus A (A), in patients with AJCC TNM stage IIIA/IIIB/IIIC/IVA/IVB versus I/II (B), and in patients with (yes) versus without (no) the pre-S2 deletion (nt 1–54) (C). P values and numbers (n) of patients were indicated in the plots. A P value < 0.05 indicated a statistically significant difference. (D) ROC curves in discriminating patients with HCC recurrence from those without. AUCs for the prognostic factors, including the pre-S2 deletion (nt 1–54) (red line), Child-Pugh cirrhosis score (green line), and AJCC TNM stage (blue line) were indicated in the plot. Abbreviations: n, number; AJCC, American Joint Committee on Cancer; TNM, tumor-node-metastasis; del, deletion; nt, nucleotide; AUCs, area under the receiver operating characteristic curves.

