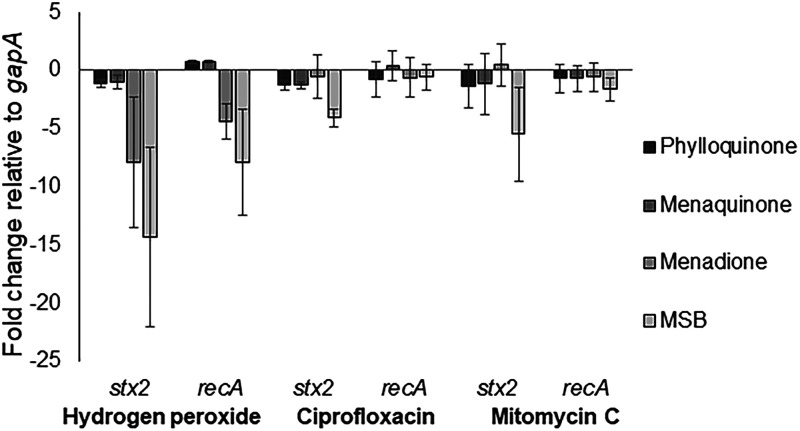
FIG 6.
Relative fold change in transcript levels of stx2 and recA in vitamin K-treated EHEC cultures compared to untreated cultures. The concentrations of vitamin K used were 72 μM for phylloquinone and menaquinone, 36 μM for MSB, and 7 μM for menadione. Data represent means from three individual experiments. The error bars represent the SD from three independent experiments.

