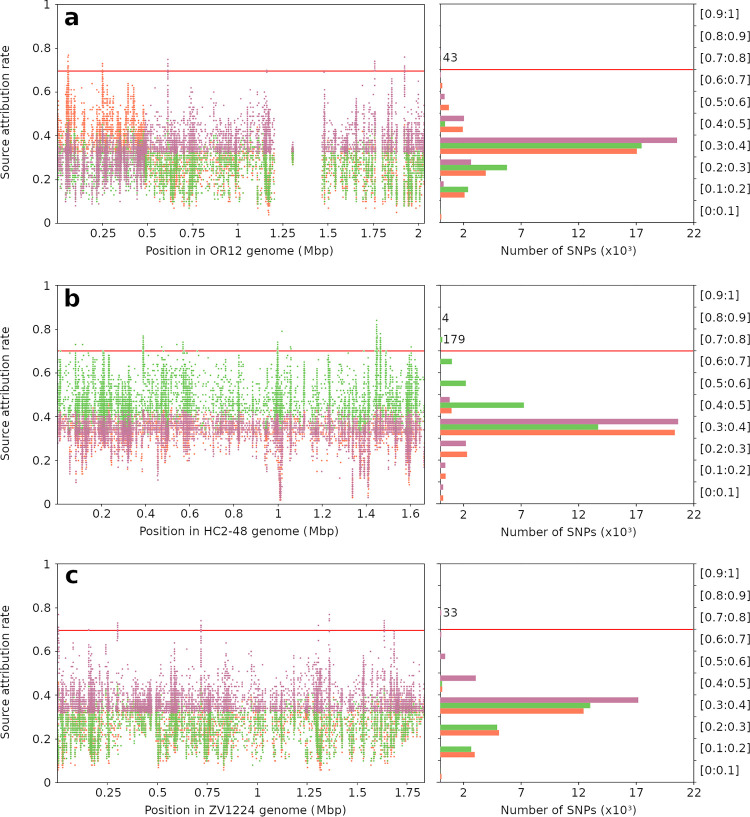
FIG 3.
Host-segregating rate of all variants obtained from the alignment of 450 marker determination isolates against 3 references. Source attribution rates (y axes) were obtained by testing 26,131, 24,395, and 20,827 SNPs from OR12 (a), HC2-48 (b), and ZV1224 (c) references, respectively, and are shown here according to their genome position (left, x axis) and variant proportions (right, x axis). STRUCTURE software was run 3 times for each SNP (average attribution rates are shown here), using 390 randomly selected C. coli isolates as the training data set and 60 randomly selected isolates as the test data set. Orange represents attribution rates and the number of SNPs for chicken source, green for cattle source, and magenta for pig source. A total of 259 SNPs showed attribution rates greater than 70% (red line) for one or more sources and were carried forward for further analyses: 43, 183, and 33 SNPs from chicken, cattle, and pig references, respectively. Scores fluctuated between 30% and 40%, and the highest attribution rates for each host reservoir were found in the corresponding source reference. However, the OR12 reference showed two distinct regions of the genome, one part containing variants discriminating the chicken source and another part the pig source. Two low-variability regions (blanks), where no SNPs from the variant calling step were selected, are also visible.

