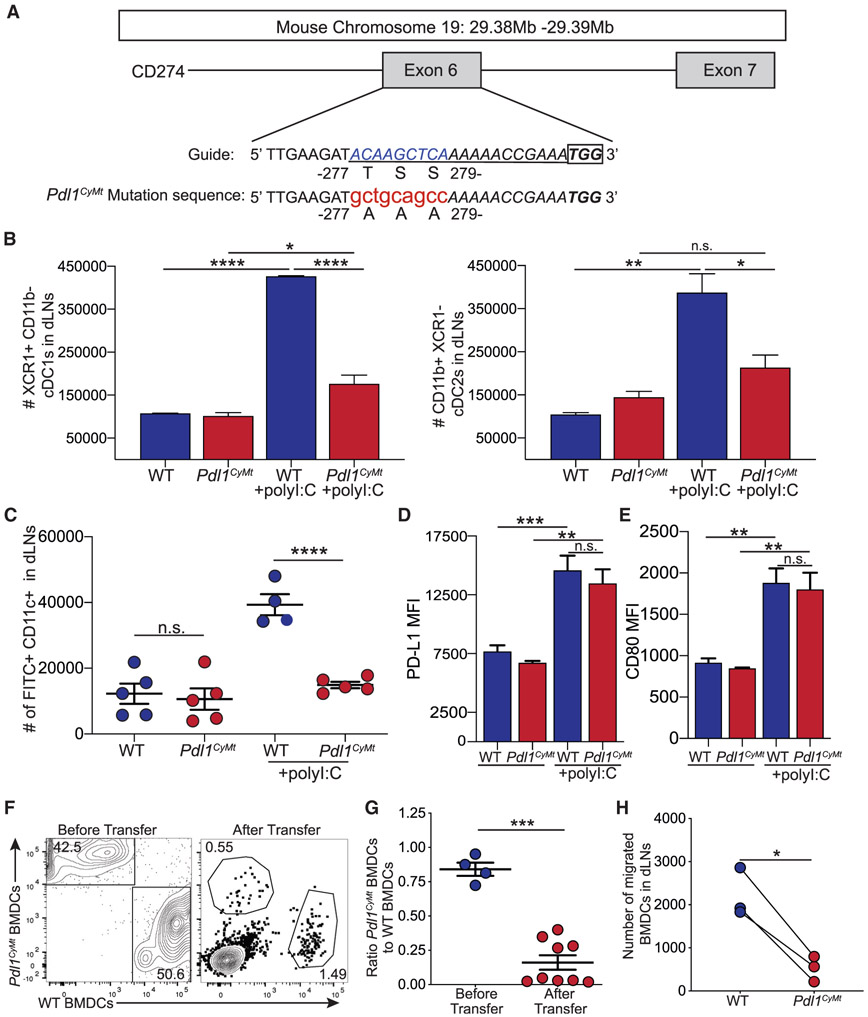
Figure 3. Creation of a Mouse Model with a Three-Amino-Acid Mutation in the Cytoplasmic Domain of PD-L1.
(A) Design of the guide RNA (underlined sequence) for CRISPR-Cas9 mutagenesis. The lowercase red letters indicate nucleotide changes leading to the amino acid replacements indicated. A recognition sequence for Pst1 (CTGCAG) was also introduced. The box indicates the PAM (protospacer adjacent motif) sequence.
(B) Total number of cDC1s and cDC2s in WT and Pdl1CyMt mice as in Figure 1A. n = 3 mice each in data shown, repeated three times with similar results.
(C) Number of FITC+ DCs migrated to the dLN as in Figure 2C. n = 4–5 mice in data shown, data combined from two independent experiments.
(D) PD-L1 expression (by mean fluorescence intensity [MFI]) on FITC+ DCs in the dLN.
(E) CD80 expression (MFI) on FITC+ DCs in the dLN.
(F) Representative flow plots of transferred WT and Pdl1CyMt BMDCs before transfer and in the dLN (after transfer) as in Figure 2G.
(G) Quantification of (F) showing the ratio of Pdl1CyMt BMDCs to WT BMDCs as in Figure 2H.
(H) Number of WT and Pdl1CyMt BMDCs in the dLN 24 h after transfer.
For (B–E), data are shown from axillary and brachial LNs combined. For (D) and (E), n = 3 mice in data shown, repeated two times with similar results. For (F–H), data are shown from popliteal LNs, n = 6 mice in data shown; data are combined from three different experiments. Statistical analysis was done using a one-way ANOVA (B–D), an unpaired Student’s t test (G), or a paired Student’sttest (H). *p < 0.05; **p < 0.01; ***p < 0.001; ****p < 0.0001. Error bars indicate standard error of the mean. See also Figures S3 and S4 and Table S1.

