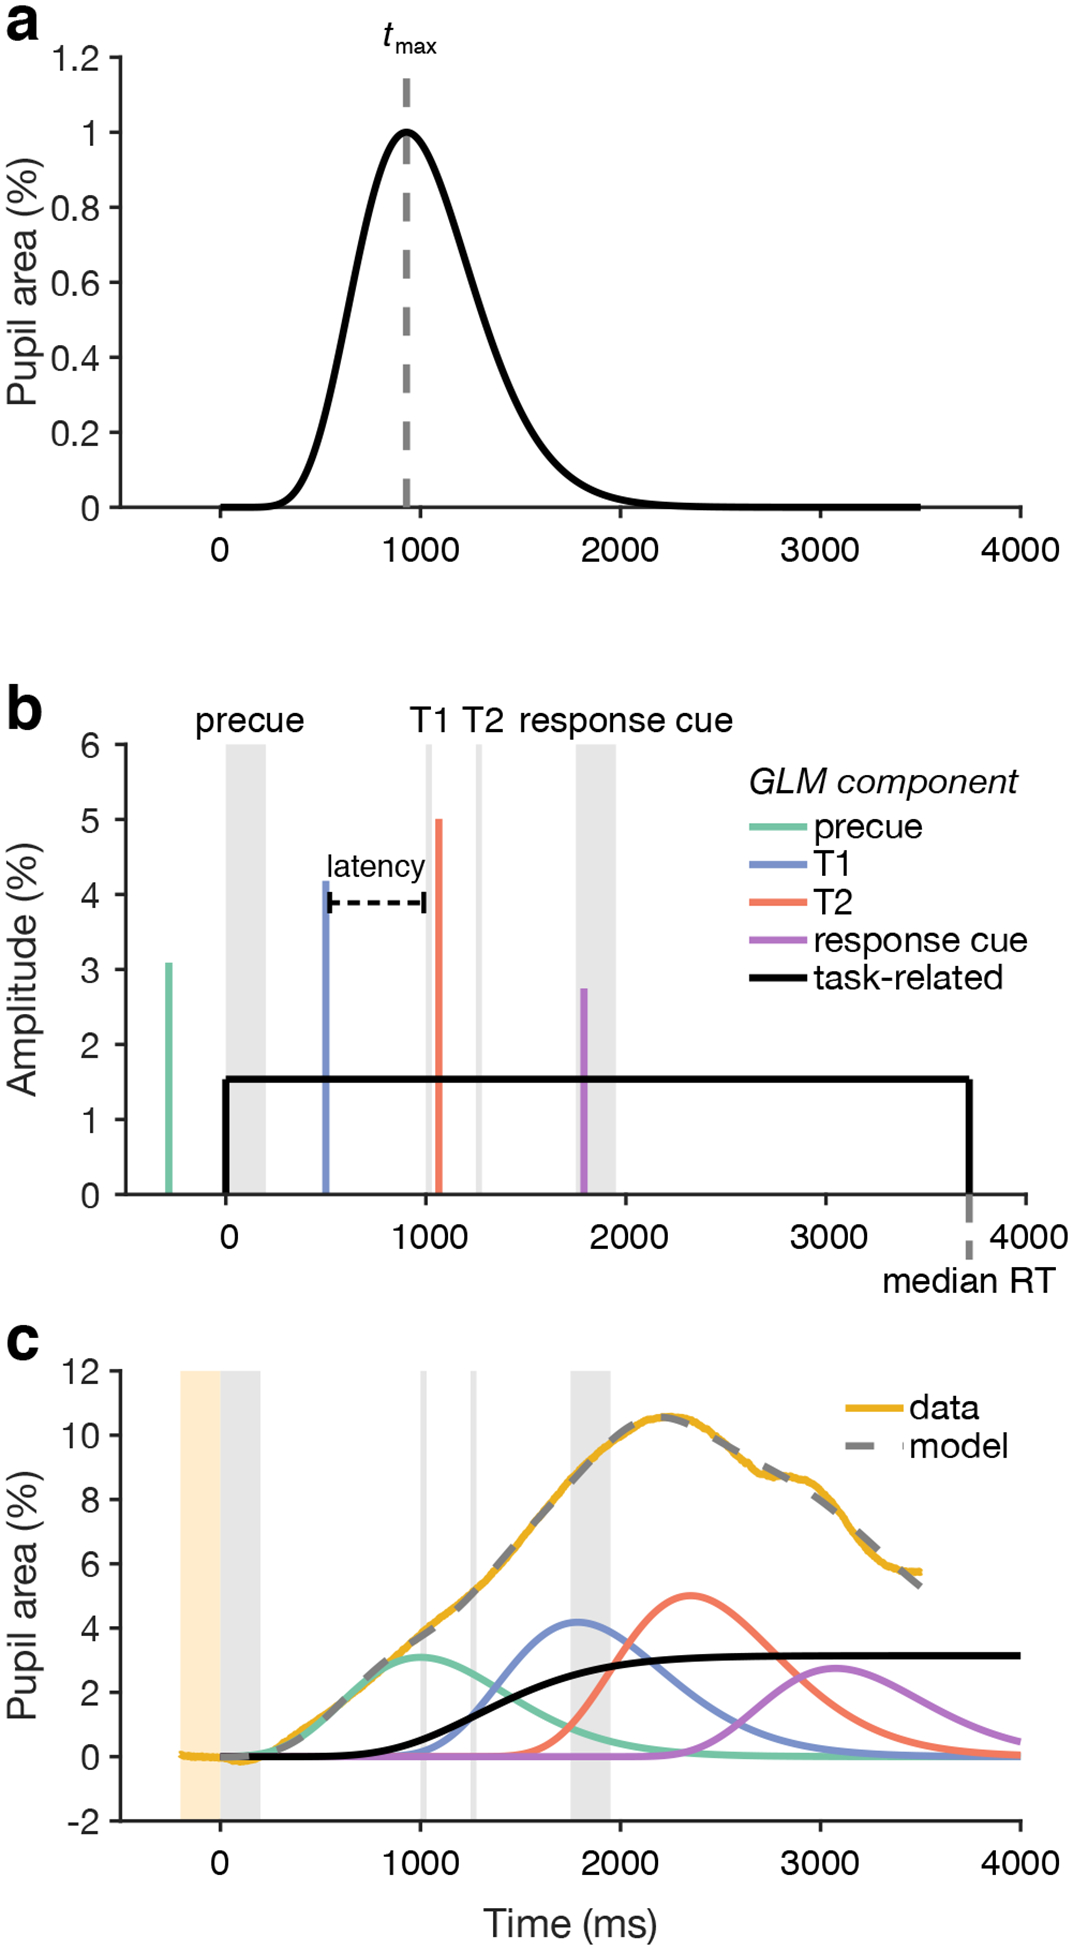
Figure 2.

General linear modeling of the pupil time series. a) Pupil response function (puRF), which describes the pupillary response to an impulse event. The canonical puRF, an Erlang gamma function with n = 10.1 and tmax = 930 ms (vertical dashed line), is shown. b) Internal signals hypothesized to drive pupil dilation. The internal signal associated with each trial event (brief auditory and visual stimuli, gray shaded regions) is modeled as a delta function (vertical colored lines) with some amplitude and some latency with respect to the event. A sustained, task-related signal could also be modeled. Shown here is a boxcar (black line), which starts at the onset of the precue and lasts until the median RT of the modeled trials. c) The mean pupil time series across trials (yellow line) is modeled in two steps. First, each internal signal time series is convolved with the puRF to form component pupil responses (colored lines, legend in panel b). Second, the component pupil responses are summed to calculate the model prediction (gray dashed line). Parameters of the model, such as the amplitudes and latencies of the internal event signals, are fit using an optimization procedure.
