
Figure 7.
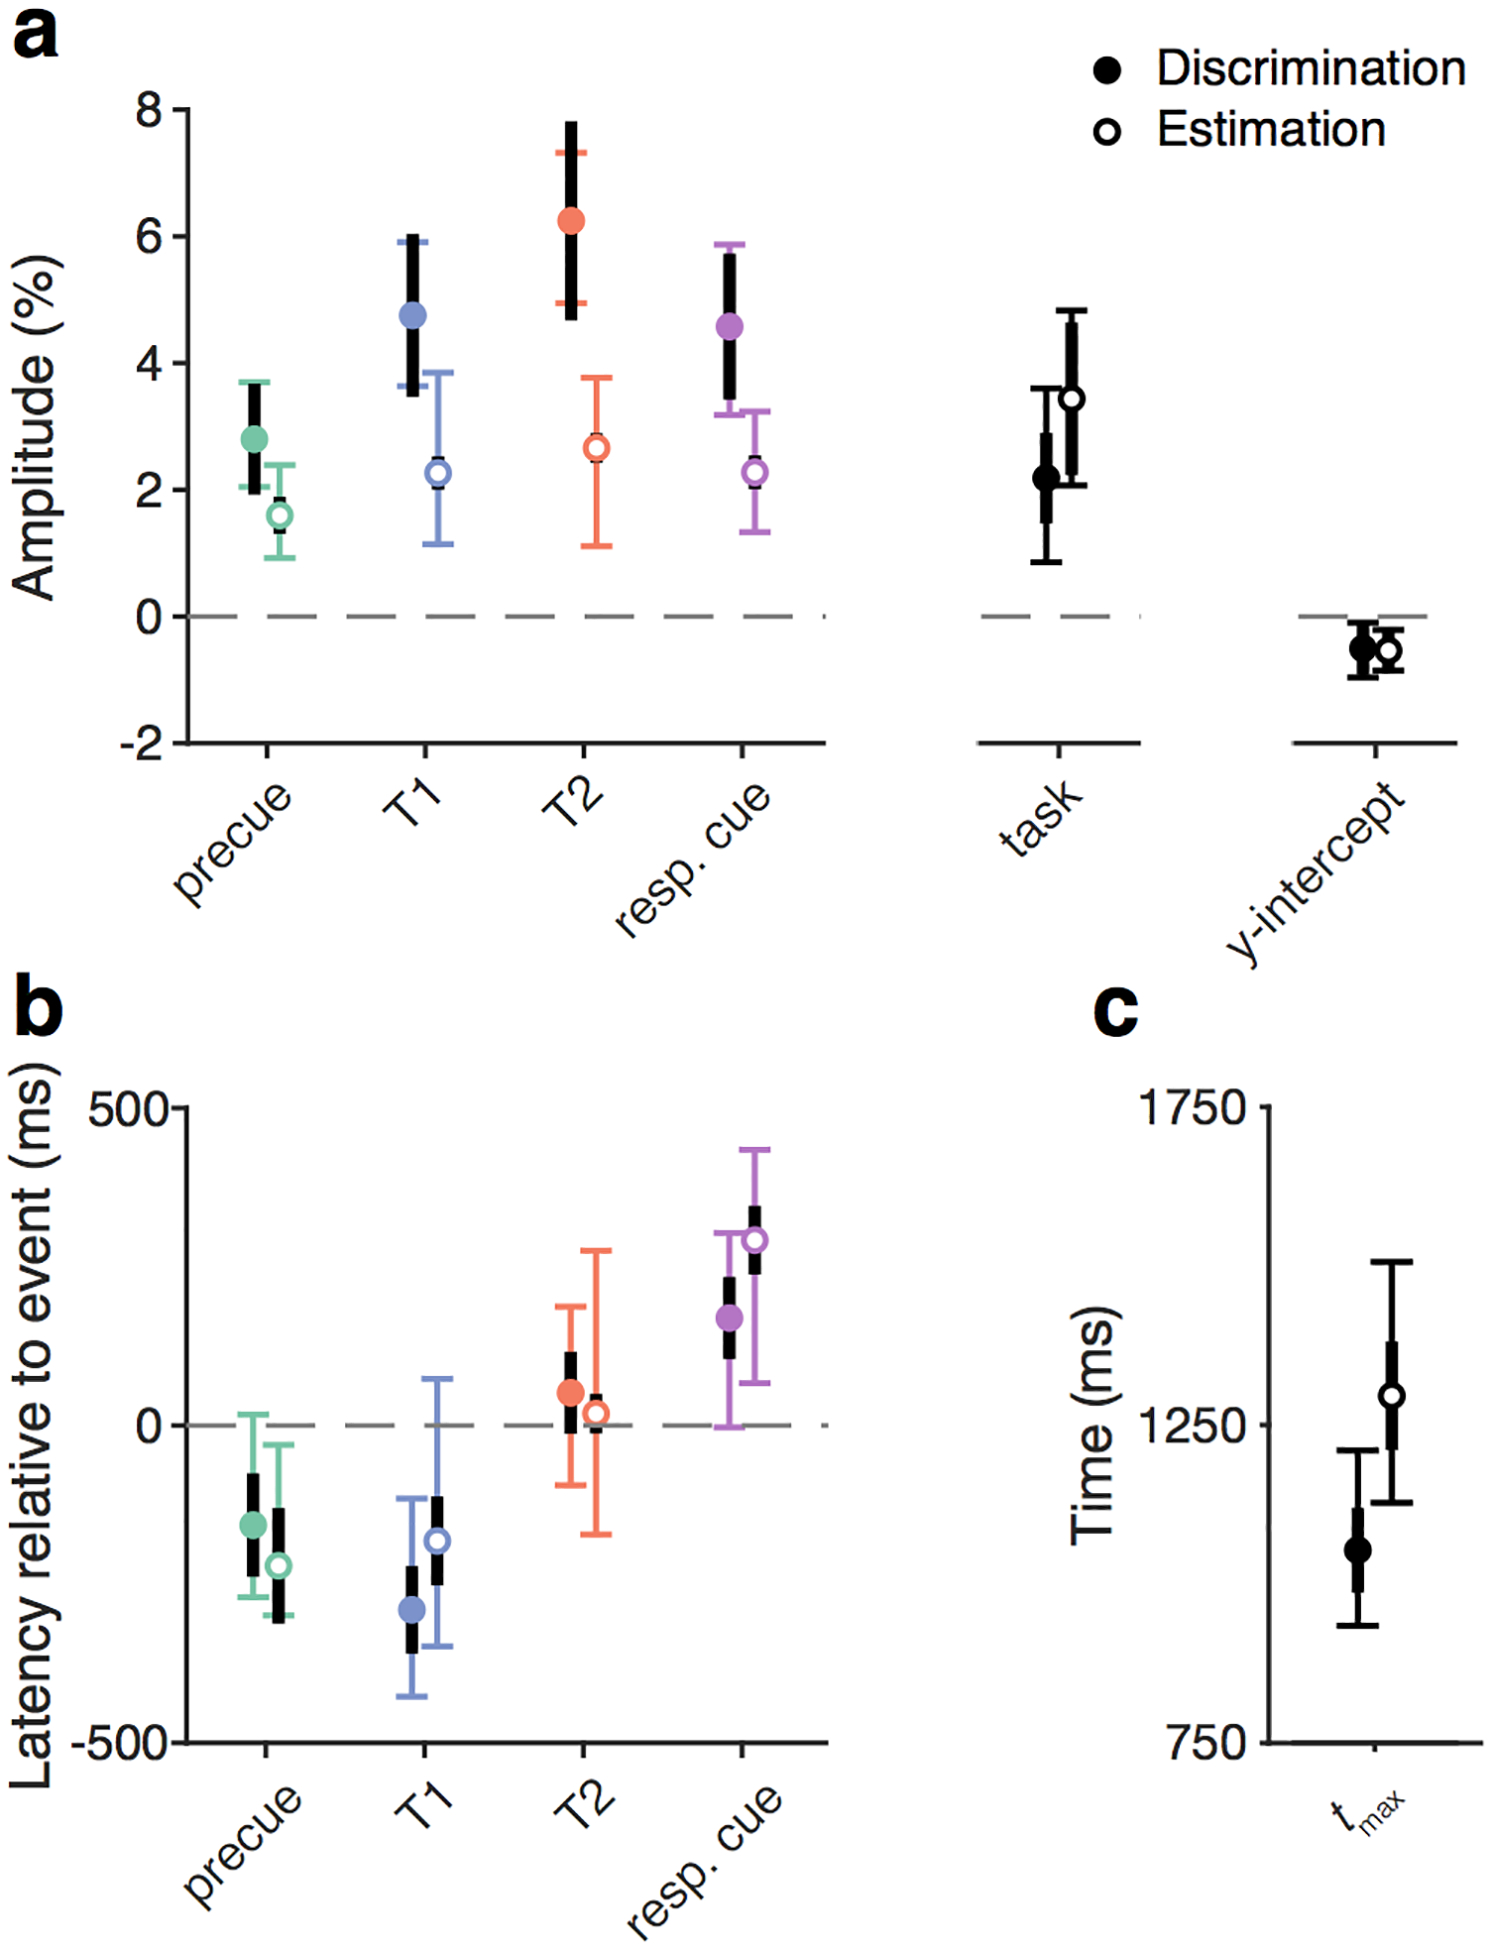
Group parameter estimates. a) Amplitude and y-int estimates. Colored points show mean of bootstrap medians across observers and conditions. Filled points are from the Discrimination experiment, empty points are from the Estimation experiment. Thin colored error bars show mean 95% confidence intervals across observers. Thick black error bars show SEM across observers. b) Latency and c) tmax estimates, plotted as in panel a.