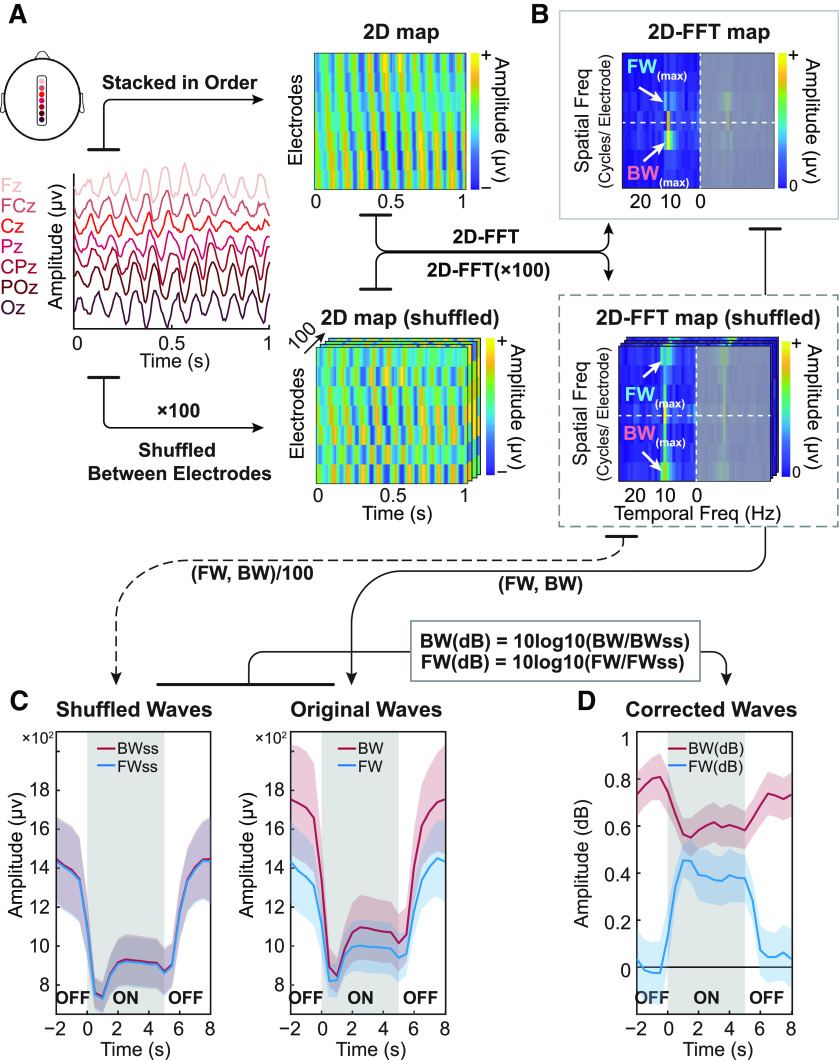
Figure 2.
α Band traveling waves in raw EEG signals. A, left, Seven midline electrodes of the 10–20 system are ordered from posterior to anterior (Oz to Fz) and backward traveling waves (BW) can be observed in the 1-s-long time window. Right, A 2D map of the same data with electrodes stacked in order and with amplitude color coded (top). To statistically quantify the waves’ direction, we employed a non-parametric test by shuffling the electrodes’ order for each time window 100 times. The resultant surrogate 2D maps eliminate the spatial structure of the original signals, including their original propagating direction (bottom). B, Temporal frequencies (x-axis) and spatial frequencies (y-axis) for both real and surrogate data are obtained by computing a 2D-FFT. The temporal frequencies were computed up to 80 Hz, but only displayed until 25 Hz for illustration purposes. Since the 2D-FFT gives symmetrical results around the origin, we only focused on the left part of the plot. The maximum value in the upper quadrant represents the strength of forward traveling waves, while the maximum value in the lower quadrant quantifies the strength of feedback traveling waves. C, left, For surrogate data, we averaged the 100 surrogate values separately for BW and FW signals and for each time bin. Colored shaded area stands for SEM across subjects; the stimulus-on period was shifted to the center part (gray shaded area) for better visualization of these dynamics around stimulus onset and offset. Right, Similar time courses were obtained for the real data. D, The surrogate line plots were used as a baseline, mostly reflecting the background (α) oscillatory power. After correcting for these baseline fluctuations (and expressing the result in dB, as per the equations), we obtained a measure of the dynamics of FW and BW waves. Colored shaded area stands for SEM across subjects.

