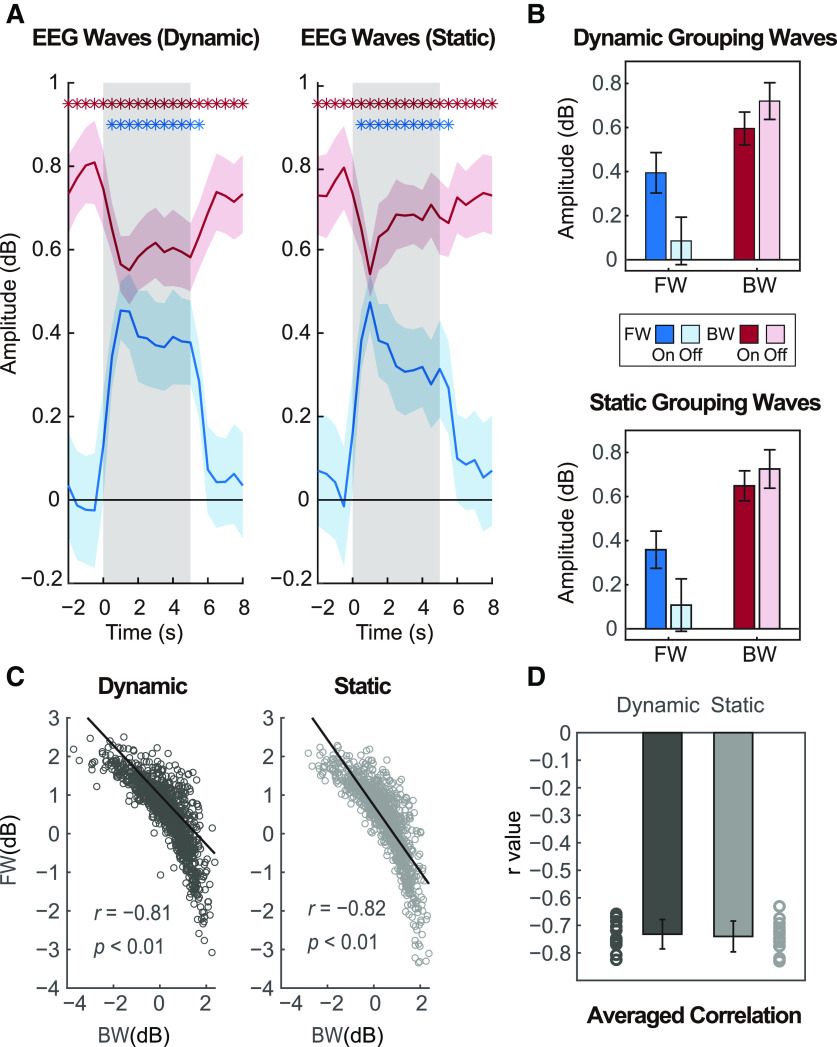
Figure 3.
Amplitude of FW and BW waves and their correlation. A, The two plots show how waves evolve over time under dynamic (white-noise visual sequences) and static (full contrast visual sequences) task conditions. Blue and red asterisks represent separately the significant time points (corrected for multiple comparisons by FDR) for FW waves (blue) and BW waves (red) when compared with zero. B, To better compare wave patterns, waves were grouped over time points within each period type (stimulus ON/OFF). C, For stimulus-on periods, we computed the correlation between BW and FW values under dynamic stimulation (left) and static stimulation (right). The two scatter plots show results from a representative subject. Each dot represents a pair of FW and BW values for each single time bin (1 s) and black lines are regression lines. D, Bar graphs show averaged correlation (r values) across all subjects for dynamic and static conditions. The corresponding circles are individual results.

