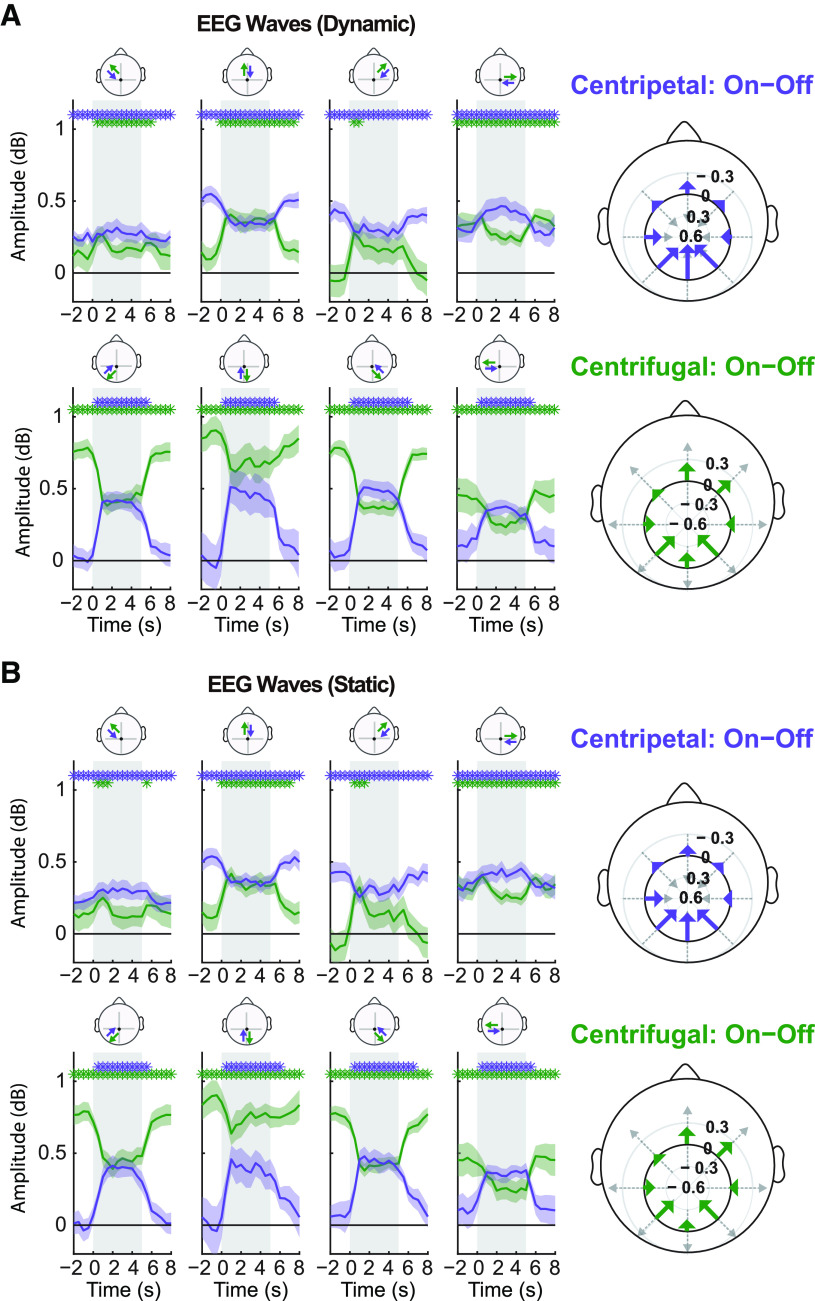
Figure 4.
Traveling waves across the scalp. A, left, Changes of wave amplitude over time under dynamic stimulation conditions. Around the central electrode CPz, we selected eight lines of electrodes to cover the whole scalp. As before, we computed two waves in opposite directions for each path (see inset topography above each subplot); here they are sorted as centripetal (toward CPz, in purple) and centrifugal (away from CPz, in green) waves. Each path counted only five electrodes, which were interpolated into seven sampling points, so as to remain comparable with our main analysis (see Fig. 3A). Right, Polar representation of the difference of wave amplitude between stimulus-on (gray shaded regions in left subplots) and stimulus-off period (white regions). Each wave is represented as an arrow, centered and aligned on the corresponding path, with a length proportional to its amplitude difference (with negative differences pointing in the opposite direction). The top image represents the vector field for centripetal waves, the bottom one for centrifugal waves. In both cases, the net effect of visual stimulation is to increase the forward propagation of the waves (and/or decrease their backward propagation, with little effect along the lateral axes). B, Traveling waves under static stimulation conditions (notations and conclusions as in A).

