Figure 1.
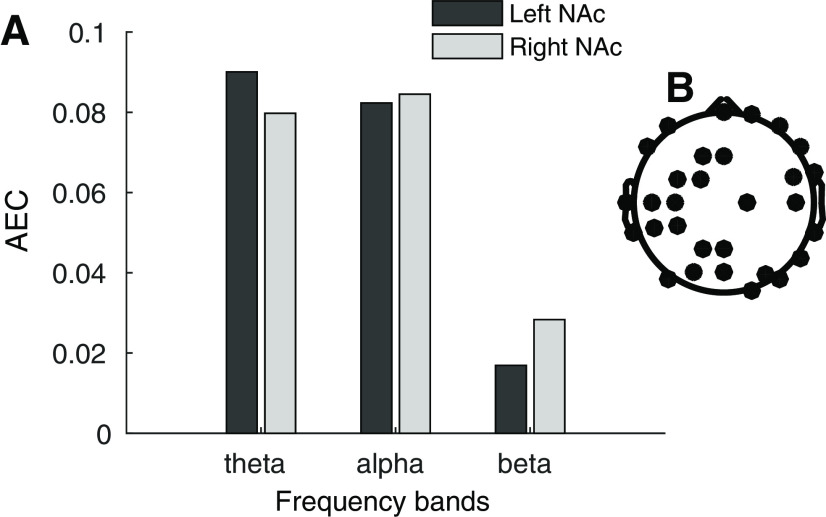
AEC in the θ (4–8 Hz), α (8–13 Hz), and β (13–30 Hz) frequency bands on the overall task. A, The bars depict average AEC between the NAc (most ventral contact point of the DBS electrode) and 30 randomly selected surface EEG channels, for the left and right NAc separately. B, Topology of the 30 randomly selected surface electrodes.

