. 2020 Nov 17;9:e58848. doi: 10.7554/eLife.58848

Figure 1. M1 rotational dynamics during reaching and grasping.

(A) Normalized peri-event histograms aligned to movement onset (black square) for four representative neurons during the reaching task (Monkey 4, Dataset 5). Each shade of gray indicates a different reach direction, trial-averaged for each reaching condition (eight total). (B) Normalized peri-event histograms aligned to maximum aperture (black square) for four representative neurons during the grasping task (Monkey 2, Dataset 2). Each shade of blue indicates a neuron’s response, trial-averaged for different object groups. (C) Rotational dynamics in the population response during reaching for Monkey 4 (Dataset 5) projected onto the first jPCA plane. Different shades of gray denote different reach directions. (D) Lack of similar M1 rotational dynamics during grasping. Different shades of blue indicate different object groups, for Monkey 2 (Dataset 2). (E) FVE (fraction of variance explained) in the rate of change of neural PCs (dx/dt) explained by the best fitting rotational dynamical system. The difference in FVE for reach and grasp is significant (two-sample two-sided equal-variance t-test, t(16) = −19.44, p=4.67e-13). Error bars denote standard error of the mean and data points represent the outcomes of cross-validation folds (across conditions – see Materials and methods) for each of two monkeys. (F) FVE in the rate of change of neural PCs (dx/dt) explained by the best fitting linear dynamical system, not constrained to be rotational. The difference in FVE is highly significant (two-sample two-sided equal-variance t-test, t(16) = −21.37 p=1.57e-14). Error bars denote standard error of the mean and data points represent the outcomes of cross-validation folds for each of two monkeys (fourfold for reaching data, and 5-fold for grasping data). The lack of dynamical structure during grasping relative to reach is further established in a series of control analyses (Figure 1—figure supplement 1).

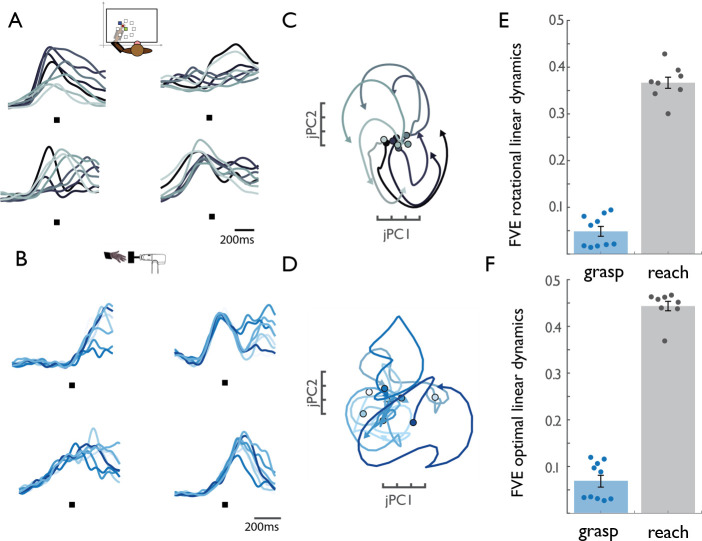
Figure 1.

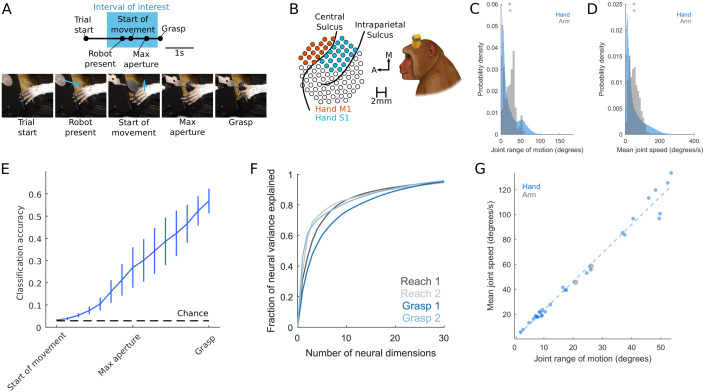
Figure 1—figure supplement 1. Grasping behavior and neurophysiology.

Figure 1—figure supplement 1.

Related to Materials and methods. (A) Time course of grasp task. Start of Movement, Maximum Aperture, and Grasp epochs were inferred based on hand kinematics. Arrows indicate motion of the robot presenting the object or motion of the hand. (B) Multi-electrode arrays were used to record neuronal activity. (C) Probability density of the range of motion, where each instance is the difference between the maximum and minimum angle of a joint DOF during a single trial. Instances are pooled across joint DOFs, sessions, and animals. (D) Probability density of mean joint angular speed, where each instance is the mean speed of a single joint degree of freedom (DOF) during a single trial. (E) Performance of a linear discriminant analysis to decode object identity on the basis of hand posture (DOFs). Objects are most discriminable just before object contact (Grasp) but are also discriminable well above chance long before contact is established (for example, at maximum aperture). Trace indicates the mean, error bars the S.E.M. across monkeys. (F) Scree plots, for both reach- and grasp-related M1 responses used in the jPCA analysis, indicating the cumulative variance explained by the first n principal components of neural activity. Principal components analysis was applied to rate-normalized, trial-averaged, Gaussian-smoothed firing rates. (G) Relationship between the mean speed and mean range of motion for each DOF. Neither the mean joint angular speed (two-sample equal-variance t-test [t(202780) = 0.65, p=0.51) nor the joint angular range of motion (t(202780) = 1.8462, p=0.0649]) differs between reach and grasp. Moreover, the two DOFs tracked during reach follow the same trend as joint DOFs during grasp (R2 = 0.9820). In other words, grasping and reaching movements are associated with overlapping distributions of joint angular speeds and ranges of motion.
© 2019, Elsevier
Panels A-E and G are reproduced from Goodman et al., 2019, with permission from Elsevier. It is not covered by the CC-BY 4.0 licence and further reproduction of this panel would need permission from the copyright holder.

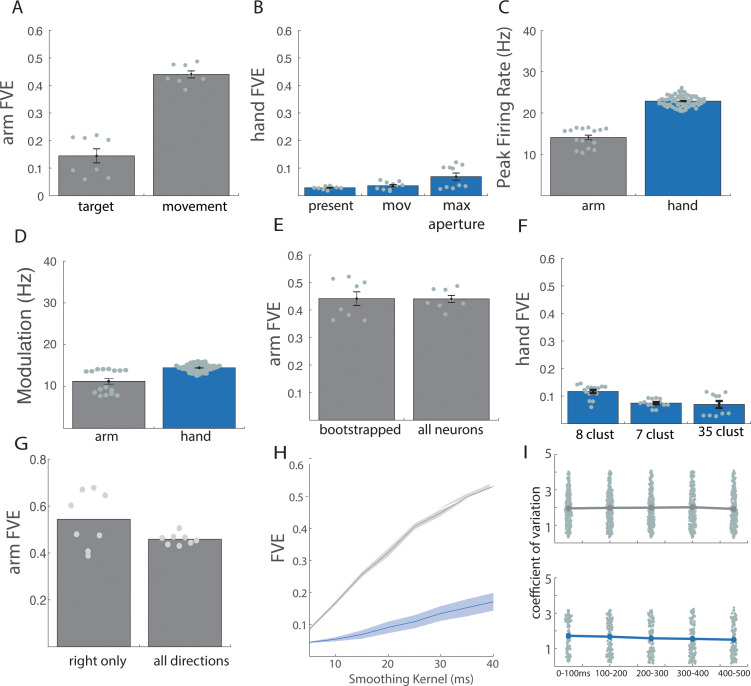
Figure 1—figure supplement 2. Control analyses for reaching and grasping.

Figure 1—figure supplement 2.

Related to Figure 1. (A) For reaching: cross-validated fraction of variance explained (FVE) in the rate of change of neural PCs (dx/dt) explained by the linear dynamical system that best fit the data, with data aligned to target presentation (target) or movement onset (movement). (B) For grasping: cross-validated FVE in the rate of change of neural PCs (dx/dt) explained by the linear dynamical system that best fits the data, when the data are aligned to a 500 ms window centered on object presentation (present), a 700 ms window centered on movement onset (mov), and a 700 ms window centered on maximum aperture (max aperture). (C) Average peak firing rate across all neurons for arm (gray) and hand (blue) responses. Each point indicates the mean peak rate for a single task condition within a single animal: for ‘arm’, this constitutes eight reaching directions across two animals; for ‘hand’, 35 objects across two animals. (D) Average neuronal modulation (90th percentile firing rate – 10th percentile firing rate, before normalization) for arm (gray) and hand (blue) responses. Each point denotes the mean modulation across trials and neurons for a single task condition within a single animal. (E) Bootstrapped responses (55 neurons) vs. full sample for reaching. (F) Cross-validated FVE in the rate of change of neural PCs (dx/dt) explained by the linear dynamical system that best fits the data when the grasping data are clustered into just a few object groups (see methods). For 8 and 7 clusters, cross validation was achieved on a leave-one-out basis. For 35 clusters, the standard fivefold (leave-7-out) cross-validation was used. Difference between 8 clusters and 35 clusters is significant (p=0.0008) while difference between 7 clusters and 35 clusters is not significant (p=0.57). However, for both clustering methods, the difference between hand and arm remains highly significant (eight clusters| p=2.5e-18; seven clusters | p=2.08e-19). (G) Cross-validated FVE for rightward arm movements only compared to all arm movements (right and left). For all figures, except where otherwise indicated, bar heights and solid lines represent the mean, shaded regions and error bars represent standard error of the mean, and each data point represents the result of an individual cross-validation fold for each of two monkeys. (H) Cross-validated FVE across various smoothing kernels (10 to 50 ms). Difference between arm and hand remains substantial regardless of smoothing. (I) Coefficient of variation (CV) of spike counts across trials within condition. Each point denotes the mean CV across each condition for a single neuron, assessed over 100 ms bins around movement onset (at 250 ms). Results indicate that trial-to-trial variability in neuronal responses is stable over the trial and similar for reach (top) and grasp (bottom).