. 2020 Nov 17;9:e58848. doi: 10.7554/eLife.58848

Figure 2. Decoding of kinematics based on population activity pre-processed with Gaussian smoothing or with LFADS.

(A) End-point coordinates of center-out reaching with actual kinematics (top) or kinematics reconstructed with neural data preprocessed with Gaussian smoothing (middle) or LFADS (bottom). Coordinates are color-coded according to the eight directions of movement. While conditions are visually separable in both Gaussian and LFADS reconstructions, the later provides a smoother and more reliable estimate. (B) Single-trial time-varying angles of five hand joints (black, dashed) from monkey three as it grasped five objects along with their decoded counterparts (Gaussian-smoothed in green, LFADS-inferred in red). Both Gaussian-smoothed and LFADS-inferred firing rates yield similar decoding errors. Here, ‘4mcp flexion’ refers to flexion/extension of the fourth metacarpophalangeal joint; ‘5pip flexion’ - flexion/extension of the fifth proximal interphalangeal joint; and ‘1cmc flexion’ - flexion/extension of the first carpo-metacarpal joint. (C) Difference in performance gauged by the coefficient of determination between decoders with LFADS and Gaussian smoothing for reach (gray) and grasp (blue). Each point denotes the mean performance increase across 10-fold cross-validation of all degrees of freedom pooled across monkeys for reach (2 monkeys with 2 DoFs each) and grasp (2 monkeys with 22 and 29 DoFs, respectively). All decoders were fit using a population of 37 M1 neurons. LFADS leads to significantly larger decoder performance improvement for reach than for grasp. Stars indicate significance of a Mann-Whitney-Wilcoxon test for unmatched samples: *** - alpha of 0.001 for one-sided alternative hypothesis.

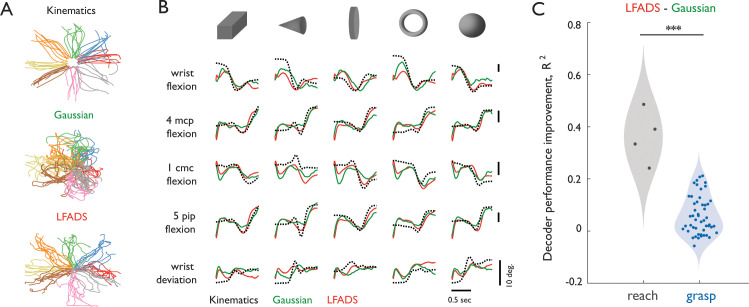
Figure 2.

Figure 2—figure supplement 1. Validation of LFADS.

Figure 2—figure supplement 1.

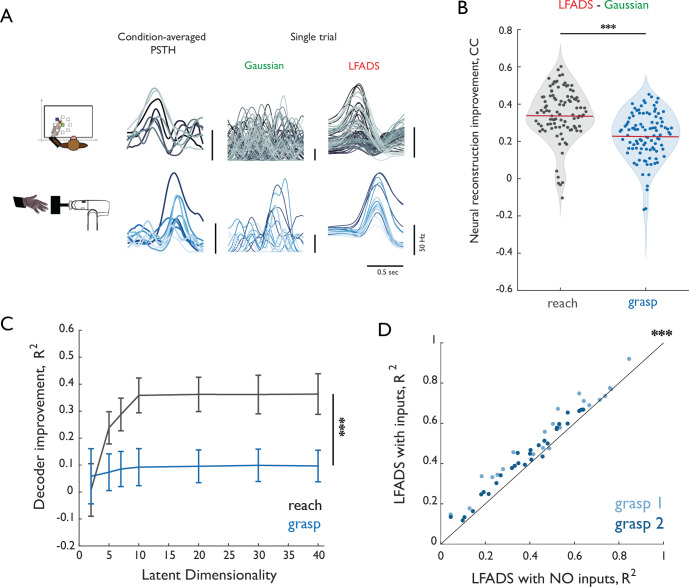
(A) Reconstruction of single trials with Gaussian smoothing and LFADS for reach (top row) and grasp (bottom row). Leftmost column shows PSTHs for eight conditions (color-coded) computed using all training trials. Middle and right columns show single-trial PSTHs for test trials color-coded by condition computed with either gaussian smoothing or LFADS. (B) Improvement in the neural reconstruction (change in correlation coefficient) with LFADS compared to Gaussian smoothing for reach (gray) and grasp (blue). Red horizontal lines denote the respective means. Stars indicate significance of two-sample, one-sided t-test (α = 0.001). (C) Difference in performance between decoders based on LFADS and Gaussian smoothing (delta R2) for reach (gray) and grasp (blue) as a function of latent dimensionality (i.e. number of inferred factors) in the LFADS model. Error bars denote the standard error of the mean for all reconstructed joints pooled from across monkeys. All decoders were trained using a population of 37 M1 neurons. Decoder performance increase with LFADS was significantly larger for reach than for grasp with as few as five dimensions. Stars indicate significance of a one-sided Mann-Whitney-Wilcoxon test for unmatched samples (α = 0.001). Differences are significant for dimensionalities greater than 5. (D) Comparison of LFADS with (ordinate) and without (abscissa) the assumption of external inputs to the dynamical system of grasp. In LFADS with inputs, we relaxed the assumption of autonomy and allowed two controllers to perturb the internal dynamics. Each point denotes the mean R2 for each of 22 DoF of Monkey three in Dataset 3 (grasp 1, light blue) and 29 DoF of Monkey one in Dataset 4 (grasp 2, dark blue). Stars indicate significance of paired-sample one-sided Wilcoxon signed rank test (α = 0.001).