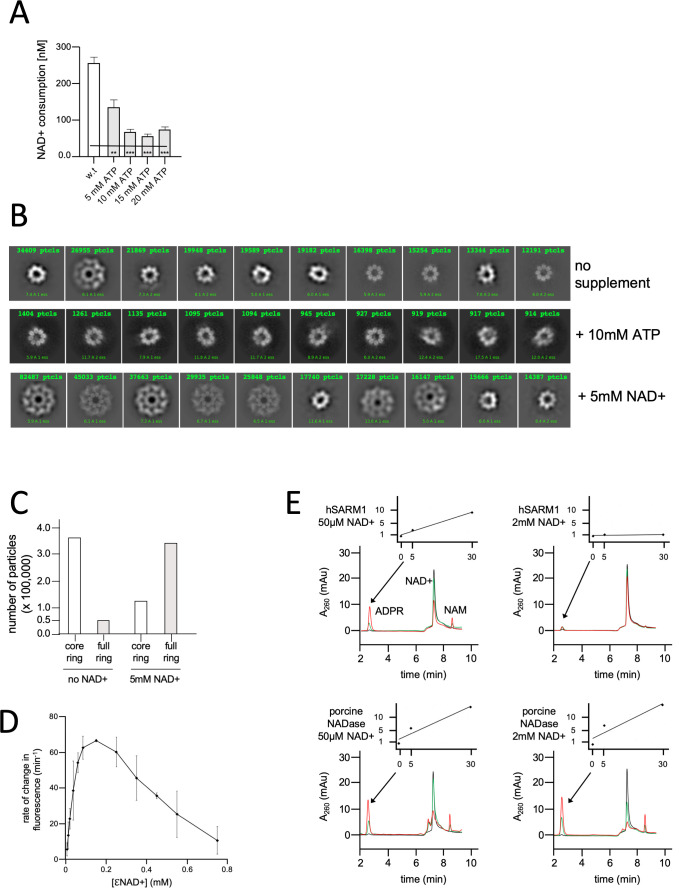
Figure 4. NAD+ induces structural and enzymatic inhibition of hSARM1.
(A) Inhibition of hSARM1 NADase activity by ATP was demonstrated and analyzed as in Figure 3F. (B) The structural effects of NAD+ and ATP were observed by cryo-EM based on appearance in 2D classification. Presented are the 10 most populated classes (those with the largest number of particles – numbers in green, first class is on the left) out of 50–100 from each data collection after the first round of particle picking and classification. By this analysis, the percentage of particles that present full, two-ring structure is 13% (no NAD+); 74% (5mM NAD+); and 4% (10mM ATP). (C) Total number of particles with full ring assembly vs. those where only the inner ring is visible. Conditions of sample preparation, freezing, collection, and processing were identical, except for the NAD+ supplement in one of the samples. (D) Rate of change in nucleotide fluorescence under steady-state conditions of eNAD hydrolysis by hSARM1. Reactions were initiated by mixing 400 nM enzyme with different concentrations of 1:10 eNAD+:NAD+ (mol/mol) mixtures. Three repeats, standard deviation error bars. (E) HPLC analysis of time-dependent NAD+ consumption by hSARM1 and porcine brain NADase control in 50 µM and 2 mM. Time points 0 (black), 5 (green), and 30 (red) min. Inset graph shows the rate of ADPR product generation. While the rate of NAD+ hydrolysis by porcine NADase is maintained through 50 µM and 2 mM NAD+, hSARM1 is tightly inhibited by 2 mM NAD+.

