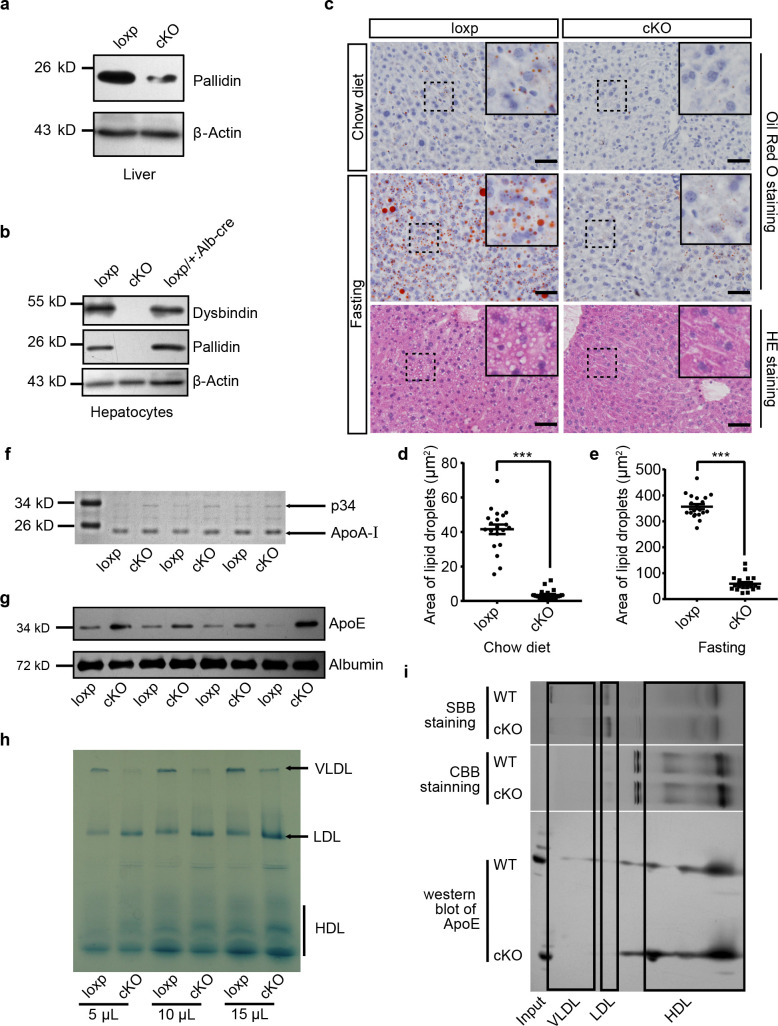
Figure 1. Mice with hepatocyte-specific deletion of BLOS1 showed abnormal lipid metabolism.
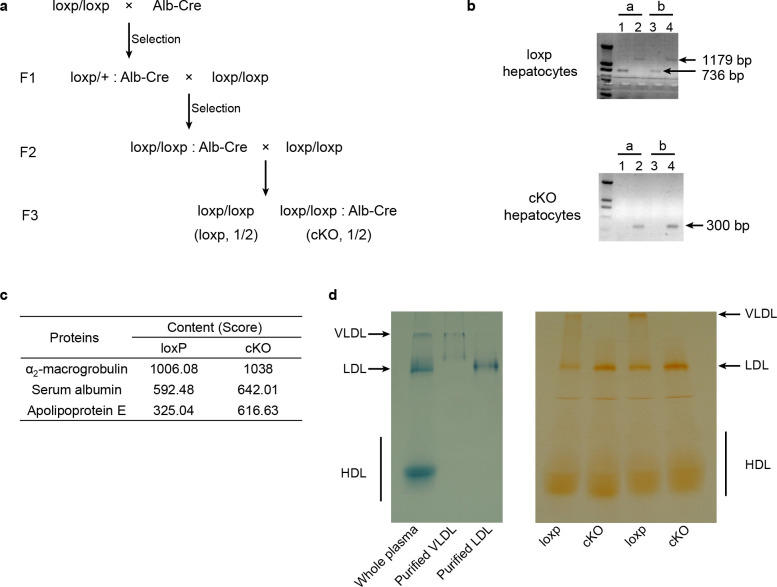
(a, b) Immunoblot of the destabilized BLOC-1 subunits (Pallidin and Dysbindin) in lysates of liver (a) and purified primary hepatocytes (b) from loxp and cKO mice. The loxp heterozygous mice in (b) were used as another control. Note that the weak band of Pallidin in (a) indicates the protein from other non-hepatocytes in the liver. (c) Representative images showing the lipid droplets in liver frozen sections of loxp and cKO mice under indicated conditions. For mice after fasting, both Oil Red O staining and HE staining results are displayed. Magnified insets of boxed areas are placed on the top right corners of each picture. Scale bars, 50 μm. (d, e) Average area of lipid droplets in 20 random 50 μm × 50 μm square regions before (d) and after (e) starvation showing reduced lipid droplet content in cKO mice. Quantifications were performed on Oil Red O stained sections. Mean ± SEM. Two-tailed t test, ***p<0.001. (f) Coomassie brilliant blue staining (CBB staining) of plasma proteins in loxp and cKO mice after separation by SDS-PAGE (see the full image in Figure 1—source data 1). (g) Immunoblot of ApoE in plasma of different loxp and cKO mice, albumin is a loading control. (h) Lipoproteins prestained by Sudan Black B in plasma of loxp and cKO mice were separated by 4–15% gradient native PAGE at different loading volume of plasma. (i) Immunoblot of ApoE in lipoproteins separated by native PAGE and a second dimensional SDS-PAGE. Gel slices of prestained lipoproteins and CBB-stained proteins were used to determine the location of different lipoproteins in immunoblots. SBB, Sudan Black B. See also Figure 1—figure supplement 1.


