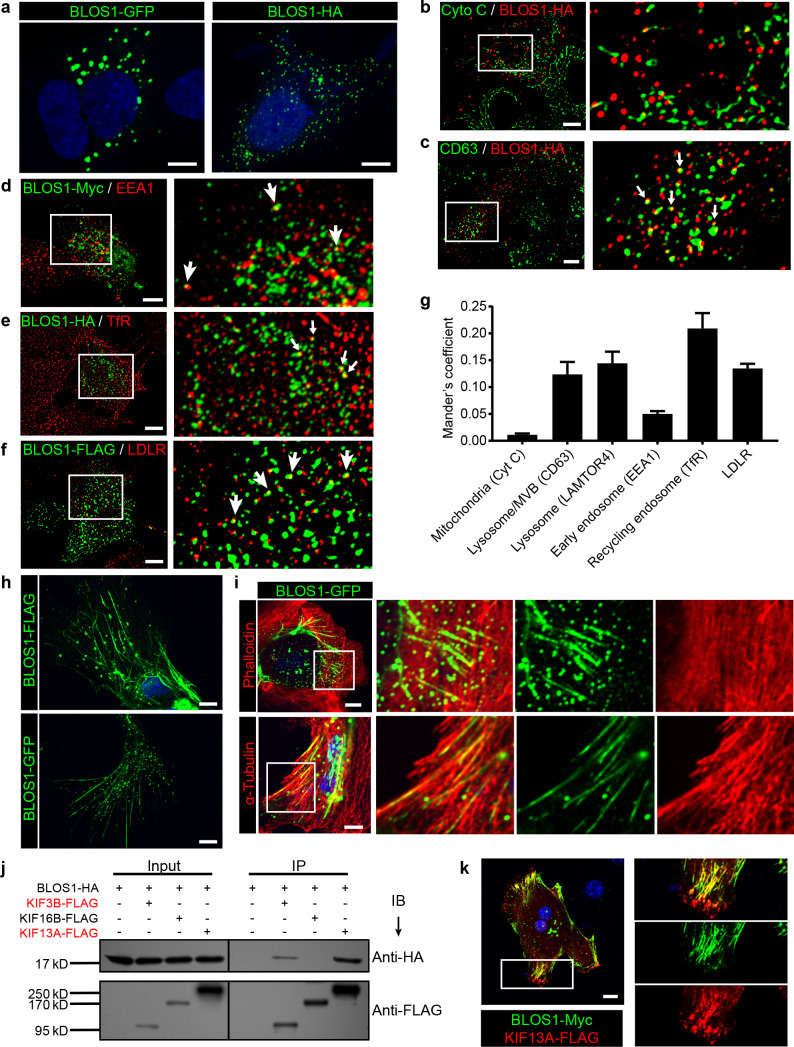
Figure 3. BLOS1 localizes to microtubules and interacts with kinesin motors.
(a) Representative confocal images of puncta patterns of BLOS1-GFP-C2 and immunofluorescence stained BLOS1-HA in Hep G2 cells. (b–f) BLOS1 partially colocalizes with multivesicular body/lysosome marker CD63 (c, white arrows), early endosome marker EEA1 (d), recycling endosome marker TfR (e) and LDLR vesicles (f) in Hep G2 cells, while almost no colocalization was observed between BLOS1-HA and mitochondria marker Cytochrome C (b). Magnified insets of boxed areas are shown on right. (g) Quantification of Mander’s colocalization coefficient showing the percentage of BLOS1 that colocalizes with other proteins or organelle markers. n = 5, 6, 6, 5, 6 and 6 from left to right, respectively. Data are presented as Mean ± SEM. (h) Representative confocal images showing tubular structures of overexpressed BLOS1 with different tags in mouse primary hepatocytes. (i) Tubular BLOS1-GFP expressed in mouse primary hepatocytes distributes on microtubule (indicated by α-Tubulin) (bottom), but not actin filaments (labeled by Phalloidin, top). Merged and single labeling images of magnified insets of boxed areas are shown in bottom panels of each figure. (j) co-IP (immunoprecipitation) of BLOS1-HA with co-overexpressed KIF3B-FLAG or KIF13A-FLAG, but not KIF16B-FLAG, in HEK293T whole cell lysate after incubation with anti-FLAG beads, followed by immunoblotting (IB). (k) BLOS1 tubules colocalize well with KIF13A-FLAG positive microtubules in mouse primary hepatocytes. Merged and single labeling images of magnified insets of boxed areas are shown on right. Scale bars in all pictures, 10 μm.

