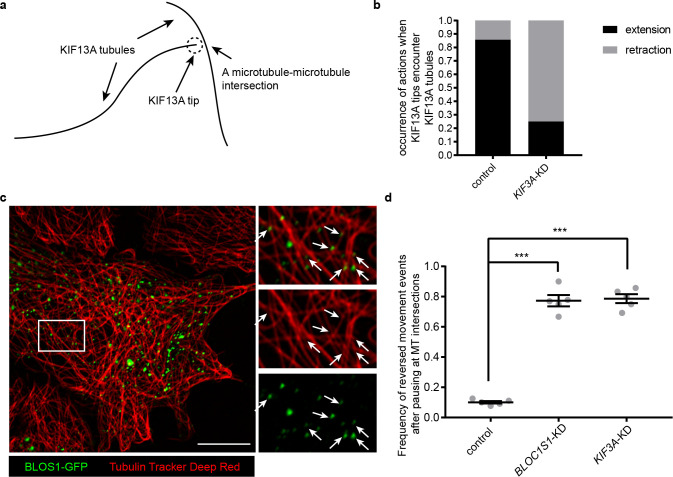
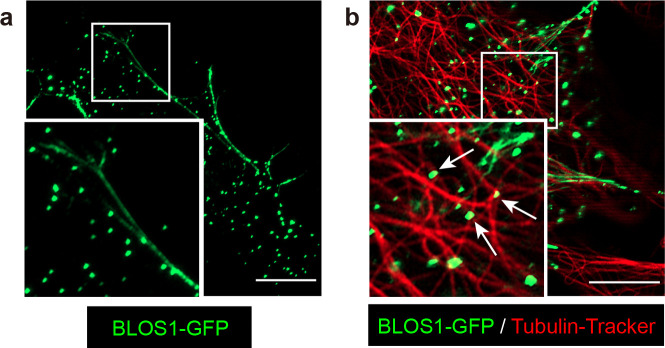
Figure 7. KIF3 and BLOS1 function at specific microtubule intersections.
(a) Schematic of tip of one KIF13A-GFP tubule encounters another KIF13A-GFP tubule. (b) Histogram showing the occurrence of extension and retraction action when tips of KIF13A tubule encounter other KIF13A tubules in control (n = 64) and KIF3A-KD (n = 100) cells. (c) Super-resolution microscopy of the BLOS1-GFP puncta (green) on microtubule tracks (red, labeled by Tubulin Tracker Deep Red) in Hep G2 cells. Merged and single labeling images of magnified insets of boxed area are shown on right. Arrows indicate BLOS1 puncta that locate near microtubule intersections. (d) Frequency of reversed movement after pausing at specific microtubule intersection was increased in both BLOC1S1-KD and KIF3A-KD cells as compared to control cells. Data are presented as Mean ± SEM, n = 5 cells. Two-tailed t test, ***p<0.001. Scale bars in all pictures, 10 μm. See also Figure 7—figure supplement 1, Figure 7—videos 1, 2 and 3.


