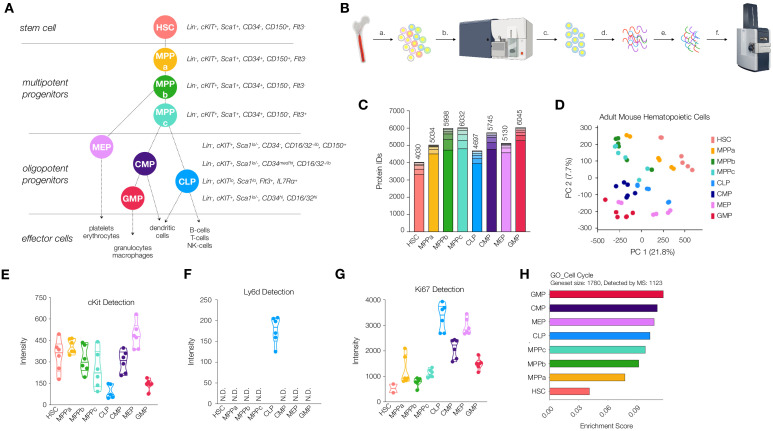
Figure 1. Workflow and validation of proteomics in various hematopoietic stem and progenitor cells.
(A) Hierarchy of hematopoietic differentiation. Hematopoietic stem cells (HSCs) give rise to multipotent progenitors (MPPs). Fate commitment arises in the oligopotent progenitor (OPP) compartment: megakaryocyte/erythrocyte progenitors (MEPs), common myeloid progenitors (CMPs), common lymphoid progenitors (CLPs) and granulocyte/macrophage progenitors (GMPs). (B) Proteomic sample preparation workflow: (a) Bone marrow cells are isolated as single-cell suspensions, (b) stained with a panel of antibodies, (c) sorted by FACS, and (d) lysed. After normalizing protein amounts, (e) the lysate is digested and desalted, and (f) peptides are subjected to mass spectrometry analysis. (C) The number of proteins identified in each cell type (N = 6). Each segment represents new proteins discovered as a result of each additional replicate. (D) Principal component analysis of all replicates of all cell types. (E) Normalized cKit protein intensity. (F) Normalized Ly6d protein intensity. (G) Normalized Ki67 protein intensity. (H) Single sample gene set enrichment analysis (ssGSEA) for GO cell-cycle-associated genes. P-adj = 0.00002. Enrichment scores were averaged across replicates for each cell type. FDR = 0.05. All violin plots show only non-zero intensity values. N.D. = not detected in any replicate.
Figure 1—figure supplement 1. Representative sorting scheme for HSCs and MPPs.
Figure 1—figure supplement 3. Protein intensity ratios of the housekeeping protein Hprt1 in stem and progenitor cells.
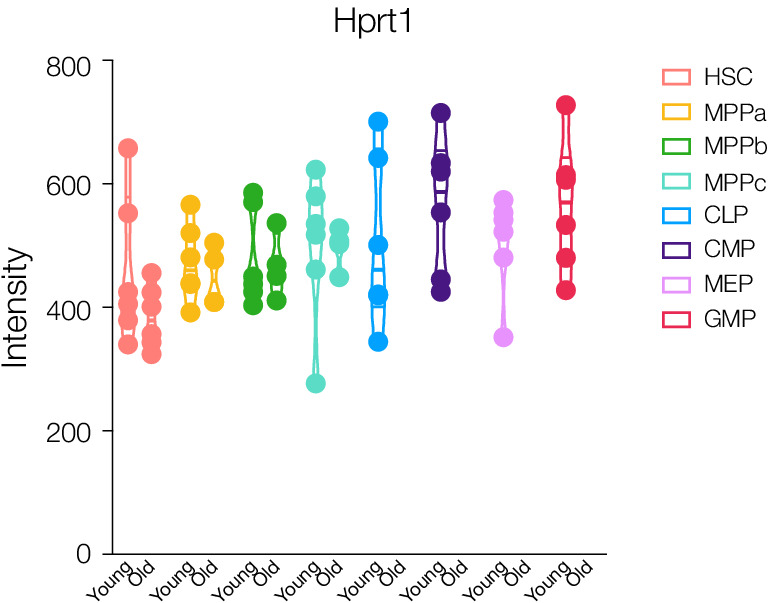
Figure 1—figure supplement 4. One-dimensional PCA plots show which components are key drivers of segmentation between cell types and cell compartments.
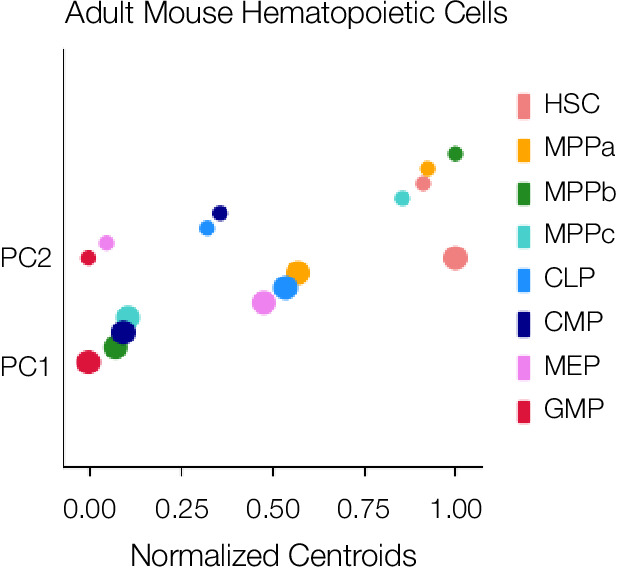
Figure 1—figure supplement 5. Relative detection of proteins used for FACS purification of cell types by flow cytometry (dark gray) and MS (light gray).
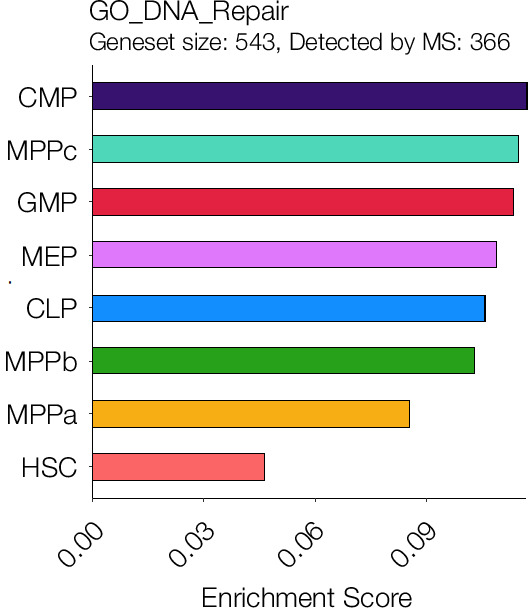
Figure 1—figure supplement 6. Single sample gene set enrichment analysis for GO DNA Repair.
