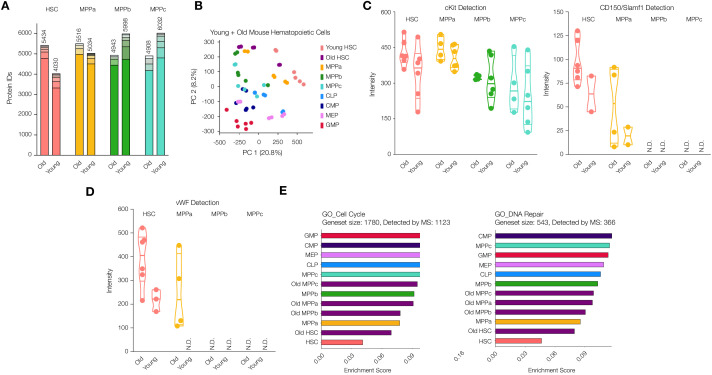
Figure 3. Proteomic comparison between young and old mouse HSCs and MPPs.
(A) Total number of proteins identified across experimental replicates for old HSCs (N = 6) and old MPPs (N = 4) in comparison to young adult mouse HSCs and MPPs (N = 6). Each segment represents new proteins discovered as result of each additional replicate. (B) Principal component analysis of all replicates of all young adult cell types and old mouse HSCs. (C) Protein intensity values for known markers of stem and early progenitor cells, cKit, and CD150. (D) Protein intensity values of von Wilebrand factor (vWF). (E) ssGSEA of GO Cell Cycle and DNA Repair-associated genes including young and old adult mouse HSCs and progenitors. P-adj = 0.00002, 0.00015 and 0.00002, respectively. Enrichment scores were averaged across replicates for each cell type. FDR = 0.05 All violin plots show only non-zero intensity values. N.D. = not detected in any replicate.
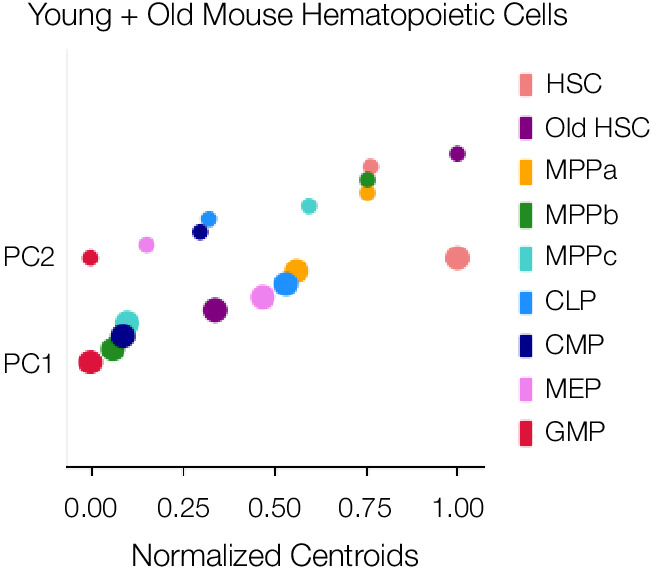
Figure 3—figure supplement 1. One-dimensional PCA plots show, which components are key drivers of segmentation between cell types and cell compartments.

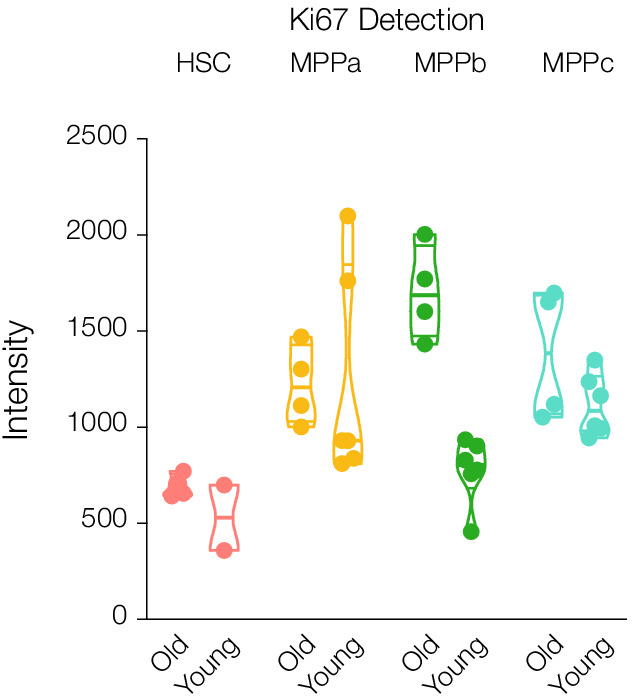
Figure 3—figure supplement 2. Protein abundance of Ki67 in young and old adult mouse HSCs and progenitors.

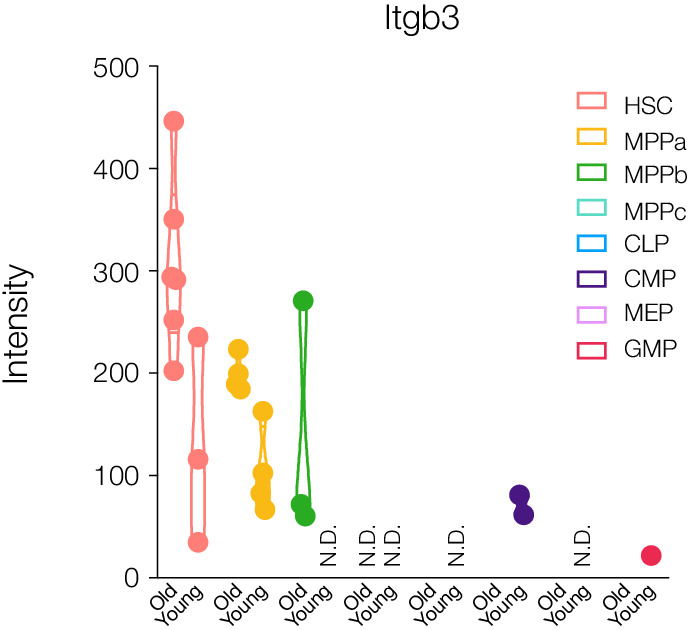
Figure 3—figure supplement 3. Protein abdundance of the age-associated protein Itgb3 in young and old adult mouse HSCs and progenitors.


