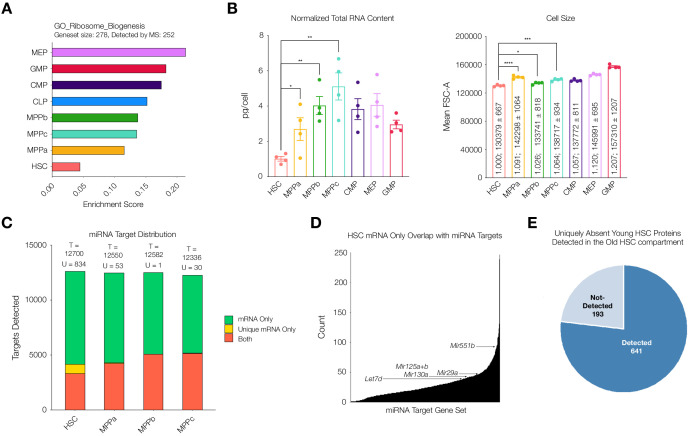
Figure 5. Potential mechanisms of regulation responsible for uniquely discordant protein to mRNA relationship in young adult mouse HSCs.
(A) ssGSEA of proteins associated with GO Ribosome Biogenesis. P-adj = 0.00003. Enrichment scores were averaged across replicates for each cell type. FDR = 0.05 (B) Total RNA content normalized with respect to cell size in each cell type. N = 4 from 5 pooled mice (3 males, 2 females). P-values: HSC vs. MPPa * = 0.0432, HSC vs. MPPb ** = 0.0012, HSC vs MPPc ** = 0.0019. Forward Scatter Area (FSC-A) for each cell type used for normalization. Relative size and mean ± standard error to the mean (SEM) FSC-A values are denoted in the bars. N = 4 mice (2 male, 2 female). P-values: HSC vs. MPPa **** < 0.0001, HSC vs MPPb * = 0.0190, HSC vs. MPPc *** = 0.0003 Error bars represent SEM. (C) Within putative miRNA targets, count of genes detected as mRNA only (Green), mRNA only uniquely to a given cell type (Yellow), or both protein and mRNA (Orange). T = total count of putative miRNA targets. U = mRNA only uniquely to a given cell type (yellow bar). (D) Count of genes that are uniquely mRNA only for young adult mouse HSCs within a given miRNA’s putative target list. Examples of potential or previously-implicated miRNAs are denoted. (E) Proteomic detection profile in old adult HSC of putative targets of miRNAs that are uniquely mRNA only in young adult mouse HSCs.
Figure 5—figure supplement 1. Ribosomal proteins that are uniquely very low or absent in each cell type.
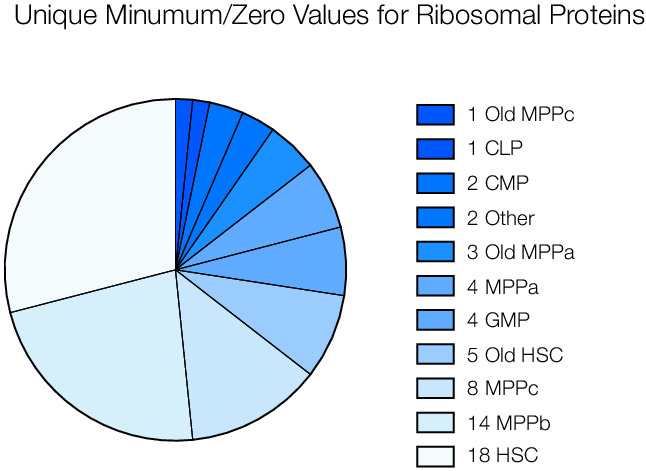
Figure 5—figure supplement 2. miRNA target null distribution analysis.
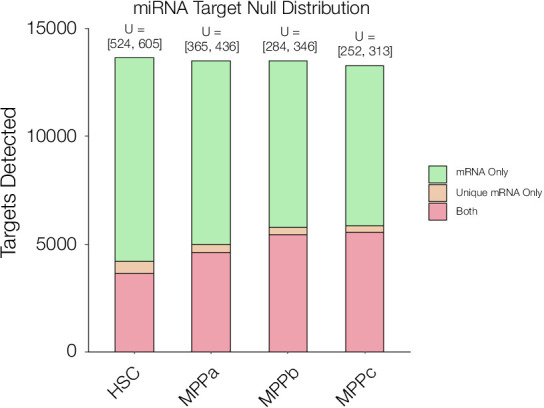
Figure 5—figure supplement 3. Comparison of mRNA levels of miRNA protein targets that are uniquely missing in the young adult HSC compartment to MPPs reveal comparable mRNA levels between cells types.
Figure 5—figure supplement 4. Percent of genes for each miRNA target list uniquely expressed as mRNA only in young adult mouse HSCs detected as protein in old adult mouse HSCs.
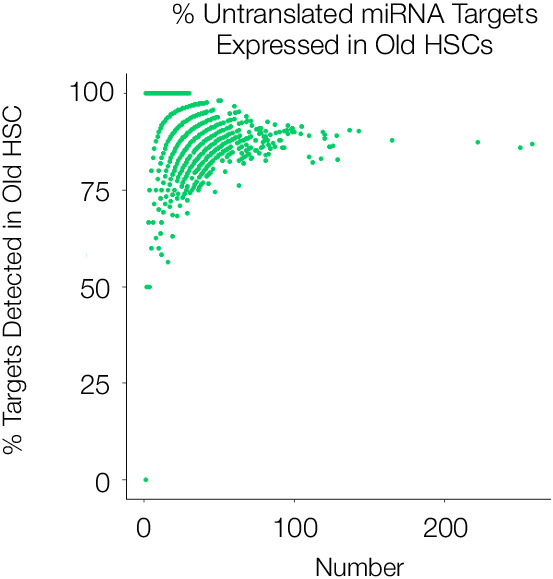
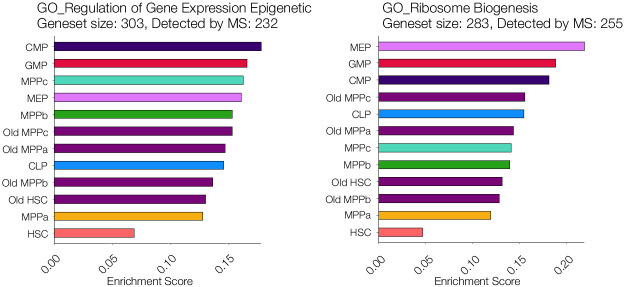
Figure 5—figure supplement 5. ssGSEA of proteins associated with GO Epigenetic Regulation, and Ribosome Biogenesis including young and old adult mouse HSCs and progenitors.
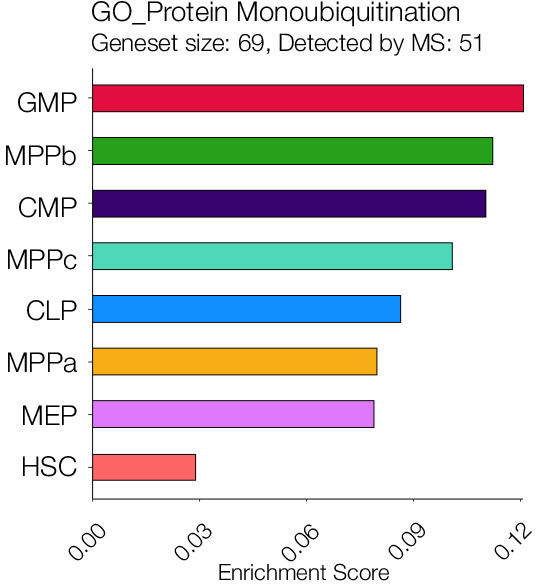
Figure 5—figure supplement 6. ssGSEA of proteins associated with GO Protein Monoubiquitination.
