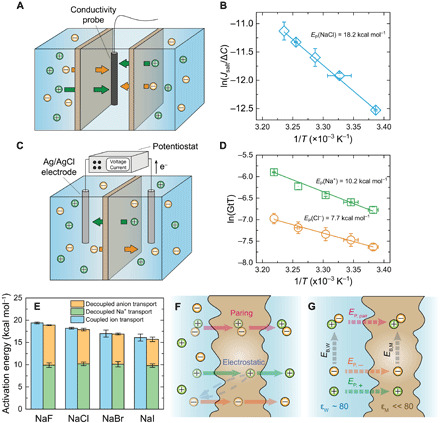
Fig. 1. Cotransport of anions and cations through a subnanometer pore membrane.

(A) Schematic diagram of the diffusion cell used for salt transport measurements. (B) Example for an Arrhenius plot for salt transport through the membrane (with NaCl). (C) Schematic diagram showing the two-chamber cell for electrochemical characterization of ion transport. (D) Example for Arrhenius plots for decoupled anion (chloride) and cation (sodium) transport through the membrane. (E) Comparison between the energy barriers for salt transport (blue columns) and individual cation (green columns) and anion (orange columns) transport. All the experiments were conducted at pH 5.7. Error bars represent SDs from duplicate measurements. (F) Schematic diagram showing two potential mechanisms for the cotransport of anion (orange spheres) and cation (green spheres) in a concentration gradient–driven process: ion pairing (top) and electrostatic interaction (bottom). (G) Illustration of a thermodynamic cycle for permeation of individual ions and ion pair through the membrane. EP, pair, EP,−, and EP,+ are energy barriers for the permeation of ion pair, anion, and cation, respectively. EB,M and EB,W are the energies released during ion association in the polyamide membrane and water, respectively.
