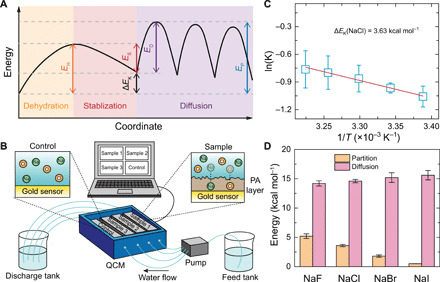
Fig. 3. Energy barriers for salt transport in the polyamide membrane.

(A) Schematic illustration of the energy barrier landscape for salt transport through the subnanometer pores in the polyamide membrane. During salt partitioning, the energy of salt first increases (EH) as partial dehydration occurs (orange region) and then declines (ES) because of stabilization inside the pore (red region). For diffusion inside the pore (purple region), salt ions need to overcome multiple energy barriers of the same size (ED). The overall energy barrier for salt permeation (EP) in a subnanometer pore is the sum of the energy change in the partition step (ΔEK = EH − ES) and the energy barrier of intrapore diffusion (ED). (B) Schematic of QCM setup and experiments. (C) An example of an Arrhenius plot for partition coefficient (with NaCl). (D) Comparison of the measured energy changes in the partitioning step (∆EK, orange columns) and energy barriers in the diffusion step (ED, pink columns) for transport of four salts in the subnanometer pore membrane. The energy barrier of intrapore diffusion, ED, was calculated by subtracting the obtained ∆EK from the overall energy barrier for the salt transport through the membranes (blue columns in Fig. 1E). All experiments were conducted at pH 5.7. Error bars represent SDs from duplicate measurements.
