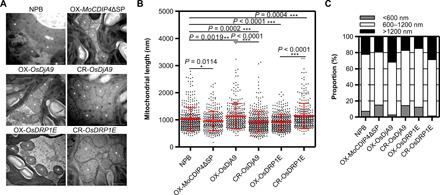
Fig. 5. OsDRP1E and OsDjA9 affect rice mitochondrial dynamics.

(A) TEM images of mitochondria from the transgenic rice (MoCDIP4, OsDjA9, and OsDRP1E) and NPB. *Mitochondria. Scale bars, 1 μm. (B) Length of mitochondria as measured with ImageJ based on multiple images acquired by TEM. Bars represent means ± SD, n ≥ 300. Asterisks indicate the significant difference according to Student’s t test. (C) Proportions of small, medium, and large mitochondria in the leaves of transgenic rice (MoCDIP4, OsDjA9, and OsDRP1E) and NPB.
