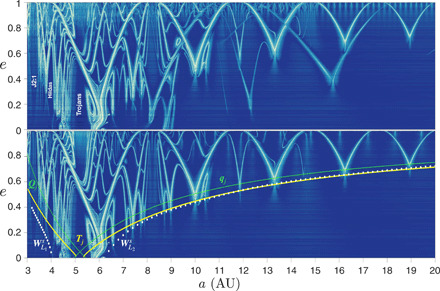
Fig. 1. Global arch-like structure of space manifolds in the Solar System.

Short-term FLI maps of the region between the outer edge of the main asteroid belt at 3 AU to just beyond the semimajor axis of Uranus at 20 AU, for all elliptic eccentricities, adopting a dynamical model in ORBIT9 that contains the seven major planets (from Venus to Neptune) as perturbers (top) or Jupiter as the only perturber (bottom). Orbits located on stable manifolds appear with a lighter color, while darker regions correspond to trajectories off of them. Three sets of dynamical boundary curves are superimposed on the map in the bottom panel corresponding to the perihelion (qj) and aphelion (Qj) lines of Jupiter (thin, green), the contour of Jupiter Tisserand parameter Tj = 3 that dichotomizes asteroids and comets (thick, yellow), and the stable manifolds of L1 () and L2 () (dotted, white). The map samples more than 2 million initial values of (a, e), where the initial inclination i, argument of perihelion ω, and longitude of ascending node Ω are set equal to that of Jupiter at the initial epoch 30 September 2012 (table S1). The initial mean anomaly of the TPs is set to 60° ahead of Jupiter in its orbit to reflect the “Greek” L4 configuration. a, semi-major axis; e, eccentricity.
