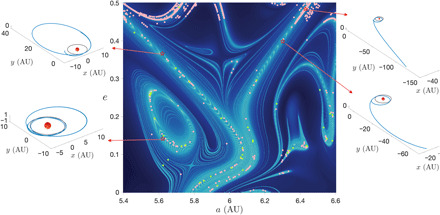
Fig. 3. A finer image of the manifolds with colliding and escaping objects along them.

A highly resolved, 1500 × 1500 point, Jovian-minimum-distance map concentrated near the largest V-shaped chaotic structure appearing in Figs. 1 and 2 (top), made using Mercurius with an integrator time step of 0.01 (equivalent to around half a day). Contained in the map is a finer image of the manifolds, where we notice small substructures wrapping around the main ones. Superimposed on the stability map are the orbits that collide with Jupiter (green dots) and all escaping trajectories (pink dots), whose dynamical transitions from elliptic to hyperbolic have been further validated by significantly increasing the tolerance within Mercurius (using a step size of 1 min). Example evolutionary states of four initial conditions (red stars) located on the structures are shown in Cartesian coordinates in the callouts, where the heliocentric orbit of Jupiter is also shown for reference (gray). The specific escaping trajectory in the top right corner was further investigated using the more realistic seven-planet model, finding that it indeed reaches more than 100 AU in less than a century in its unbounded evolution. Animations of collisional and escaping orbits are given in movies S2 and S3, respectively. a, semi-major axis; e, eccentricity.
