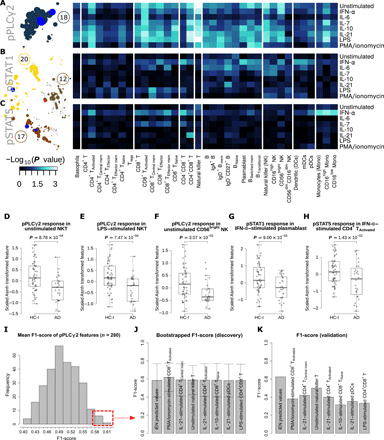
Fig. 4. Heatmaps and box plots of the intracellular response in the PBMC of the selected communities highlight immune features for AD/HC-I classification and examination of the predictive power by F1-score of pPLCγ2 as a standalone biomarker.

(A to C) Heatmap of the pPLCγ2, pSTAT1, and pSTAT5 responses by PBMC subtypes and stimulations. The color of the heatmap scaled with the Wilcoxon rank sum test P value of the difference in response of the immune feature between HC-I and patients with AD. The network communities annotated with these responses (communities 12, 17, 18, and 20) were depicted on the left-hand side of the heatmap. The size of the nodes in the community corresponds to the Spearman’s coefficient of the immune feature. The features within the communities that were selected by reduced iEN model (14 components) retained their red/blue colors corresponding to the direction of the component. (D to H) Box plots showing the significant difference of the selected immune features from the heatmap. These are mostly features associated with the most informing components of the iEN model. (I) The distribution of the mean F1-score in the test set from 1000 iterations of leave-group out test for each of the 280 pPLCγ2 features from different cell types and stimulating conditions in the discovery set. (J) The mean F1-score and its SD for the top seven performing pPLCγ2 features in the discovery cohort compared to the iEN predicted values. (K) The F1-score for each of the top seven features and iEN predicted values in the validation set. Tregs, regulatory T cells.
