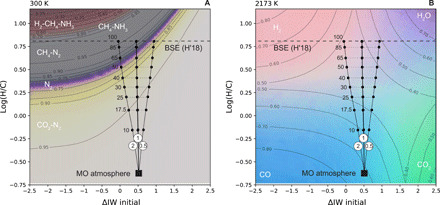
Fig. 4. Effects of oxygen fugacity and H/C on atmospheric speciation.

Approximately 21,000 Gibbs free energy minimizations using FactSage 7.3 (61) were performed each at 100 bar and (A) 300 K and (B) 2173 K. Mole fractions of the gas species were linearly interpolated over a grid with variables of log(H/C) and logfO2 expressed relative to the IW buffer. Colors shown are mixtures between end-members in (A) light green = CO2; purple = N2; gray = CH4; white = NH3; red = H2, where contour lines correspond to the mole fractions of CO2 below the N2 band and CH4 above; and in (B) red = H2; purple = H2O; green = CO2; blue = CO. Contour lines show the mole fractions of each species listed in each corner. Overlain on these calculations are lines showing the atmospheric log(H/C) ratio (−0.66) and ΔIW (+0.5) calculated in equilibrium with the Earth’s magma ocean (MO) at 2173 K with an Fe3+/ΣFe = 0.037. Hydrogen degassing models (black curves) are shown for three different H2/H2O ratios whose value is listed in the white circles. Numbers next to dashed horizontal lines refer to the percentage of H degassed from the BSE composition of Hirschmann (2018) (H′18) (53). The BSE is a strict upper limit because it neglects the small solubility of H in nominally anhydrous minerals and/or inefficient degassing.
