
Fig. 1. Injury and proliferation of ECs after influenza infection in vivo.
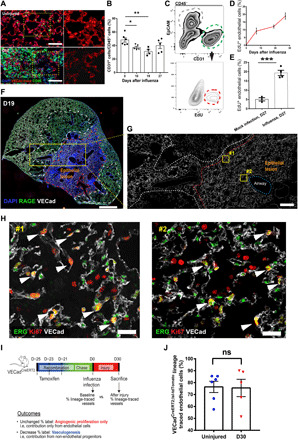
(A) Representative immunofluorescence images of capillaries (red) and leukocytes (green) in lung tissue with or without influenza injury. Scale bars, 50 μm. D10, day 10. (B) Quantification of ECs (CD31+) in the nonleukocyte fraction (exclusion of CD45+ cells) via flow cytometric analysis. (C) Representative gating scheme for identification of proliferating EC analysis via EdU incorporation at day 19 after influenza. (D) Intracellular flow cytometry quantification of proliferative ECs (CD45−/EpCAM−/CD31+/EdU+) as a percentage of total lung ECs on days 0, 7, 19, and 27 after influenza infection. n = 3 to 4 per group. (E) Cumulative endothelial proliferation on day 27 after infection and mock-infected controls. (F) Typical image of lungs at day 19 after influenza. Red dashes represent the lung epithelial lesion area (RAGE−), and the white dashes area represents the VECad low-expression area. Scale bar, 1 mm. (G) The enlarged area from (F) shows the vascular endothelium across normal and injured epithelial areas (white, VECad). Scale bar, 200 μm. (H) Representative immunostaining of proliferative ECs from peripheral (#1) and central (#2) parts of epithelial lesion on day 19. Arrows indicate proliferative ECs (colocalization of ERG and Ki67). Scale bars, 25 μm. (I) Methodology to determine whether regenerated ECs are derived from preexisting endothelium or transdifferentiation of another cell type. (J) Statistical analysis of the level of lineage-traced ECs in uninjured and day 30 after infection mice. Each point in (B), (E), and (J) represents one mouse. Data in (B) were calculated using one-way analysis of variance (ANOVA), followed by Dunnett’s multiple comparison test; data in (E) and (J) were calculated using unpaired two-tailed t test. Data are presented as means ± SEM. *P < 0.05, **P < 0.01, and ***P < 0.001. ns, not significant.