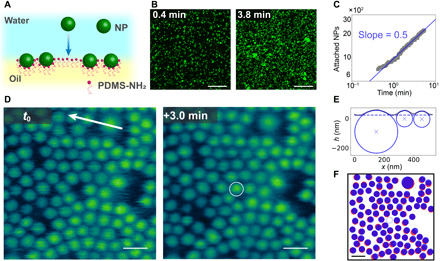
Fig. 1. Attachment of NPs to sparsely populated water-oil interface.

(A) Schematic diagram showing the attachment of a NP to the pristine water–oil interface. (B) Confocal microscopy images showing the attachment of 500-nm NPs to the water-oil interface. (C) Number of attached 500-nm NPs as a function of time, where the slope follows at power law of 0.5. (D) In situ AFM image of 100- and 300-nm NPs assembled at the water-oil interface at different times: t0 and t0 + 3.0 min, with a circle highlighting an attachment event. (E) Section data along arrow in (D) showing fit for NP diameter size and position in the interface. (F) Positions of the assembled NPs at different times: t0 (red) and t0 + 3.0 min (blue), where the open blue circle represents the newly attached NP. Scale bars, 20 μm (B) and 200 nm (D and F).
