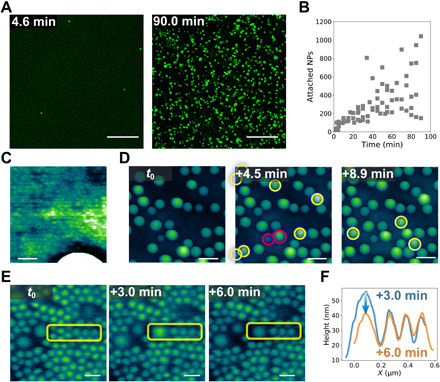
Fig. 3. Attachment of NPs to the water-oil interface with assembled NPs.

(A) LSCM images showing the attachment of 500-nm NPs to the water-oil interface with assembled 70-nm NPSs. (B) Number of 500-nm NPSs in the field of view as a function of time. (C) In situ AFM images show the coassembly of 30- and 300-nm NPSs at the water-oil interface. (D) In situ AFM images showing the attachment of 300-nm NPs to the water-oil interface with assembled 30- and 300-nm NPSs. (E) Time-dependent in situ AFM images showing the attachment of a 300-nm NP to the water-oil interface covered by 100- and 300-nm NPSs, where the yellow rectangles indicate the affected areas. (F) Line profiles of the region shown in (E) indicate the relaxation of the newly attached 300-nm NP. Scale bars, 20 μm (A), 100 nm (C), 500 nm (D), and 200 nm (E).
