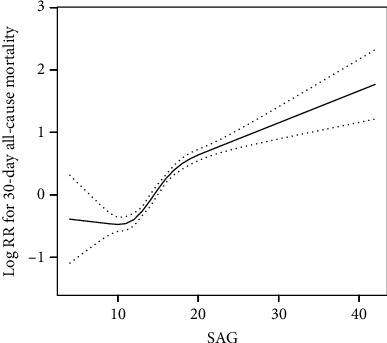
Figure 2.

Construction of the smooth curve fitting of the risk of 30-day all-cause mortality and SAG using a generalized additive model. Dashed curves were for the 95% of confidence interval.

Construction of the smooth curve fitting of the risk of 30-day all-cause mortality and SAG using a generalized additive model. Dashed curves were for the 95% of confidence interval.