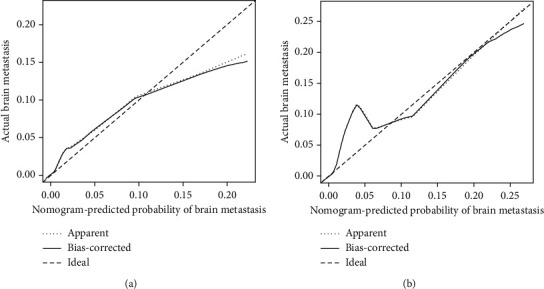
Figure 4.

Calibration curves of the nomogram for predicting BM in patients with RCC in the training cohort (a) and the validation cohort (b). The x-axis represents the nomogram-predicted probability of BM; the y-axis represents the actual probability of BM. Plots along the 45-degree line indicate a perfect calibration model in which the predicted probabilities are identical to the actual outcomes.
