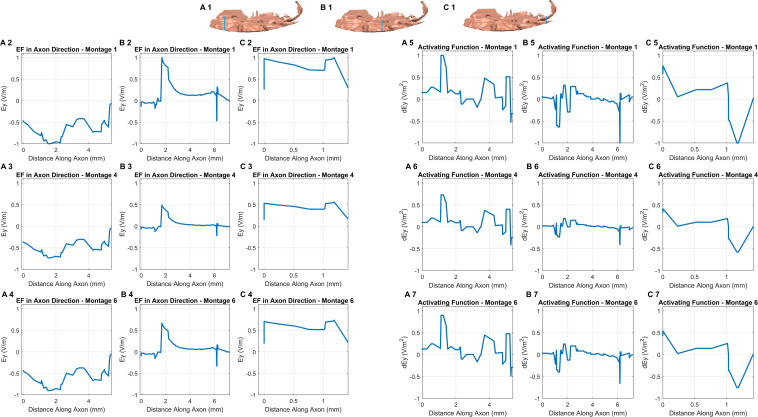
FIGURE 5.
EF along the axon and activating function. We first assumed an exemplary axon in each of the three sub-sections (blue line in each section shows the location) and in an orientation reflective of the actual anatomical situation (A1, B1,C1). The axon considered in the third sub-compartment was the shortest given the lack of tissue in the region. For each of the axons, we considered the EF component aligned with the axon for each montage (section on the left). We repeated the same by considering the activating function (section on the right). The plots were normalized relative to the highest induced value (observed in Montage 1) to facilitate easier comparison.

