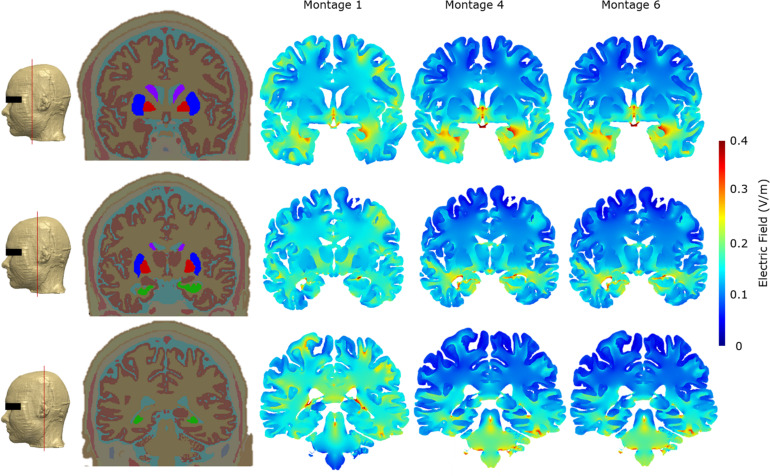
FIGURE 6.
Cross-section segmentation and brain electric field plots for the three optimal montages. All false color maps were generated between 0 and 0.4 V/m. The slices were chosen to evaluate cross-sectional current flow in the basal ganglia and hippocampus regions. The first column shows the level at which the representative coronal images were taken in the FE model. The second column shows the coronal whole head tissue segmentation images; purple, caudate nucleus; blue, putamen; red, globus pallidus; green, hippocampus; pink, substantia nigra. The third column shows Montage 1, the fourth column shows Montage 4, and the fifth column shows Montage 6.

