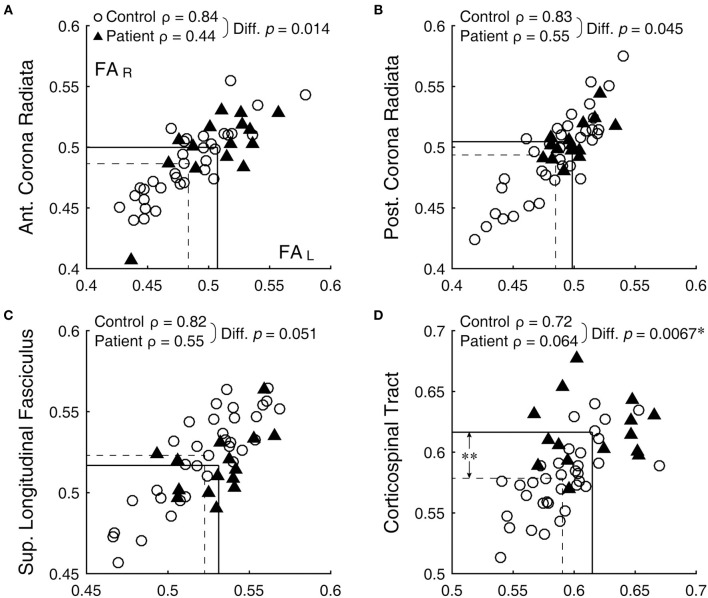
Figure 1.
Bilateral correlation of FA values. (A) anterior corona radiata, (B) posterior corona radiata, (C) superior longitudinal fasciculus, and (D) corticospinal tract. Open circles and filled triangles indicate control and patient subjects, respectively, with the left and right FA values represented by the abscissa and ordinate, respectively. Dashed lines indicate means of the control group and solid lines those of the patient group. *Significant difference (with correction for multiple comparison) between the ρ-values. **Significant difference (with correction for multiple comparison) between the means (see Table 1).

