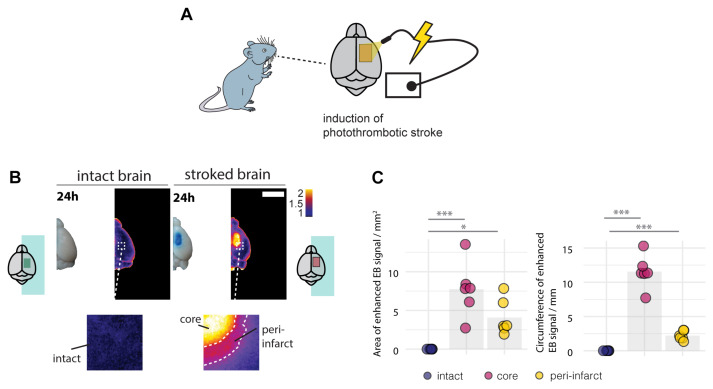
FIGURE 1.
Disruption of the blood brain barrier 24 h following the photothrombotic stroke. (A) Schematic representation of photothrombotic stroke induction in the sensorimotor cortex. (B) Macroscopic and pseudo-colored image in stroked and non-stroked animals showing the Evans blue (EB) extravasation in stroke core and penumbra. Scale bar: 5 mm. (C) Quantitative assessment of area and circumference of EB signals. Each dot in the plots represents one animal and significance of mean differences between the groups was assessed using Tukey’s HSD. Asterisks indicate significance: ∗P < 0.05, ∗∗P < 0.01, ∗∗∗P < 0.001.

