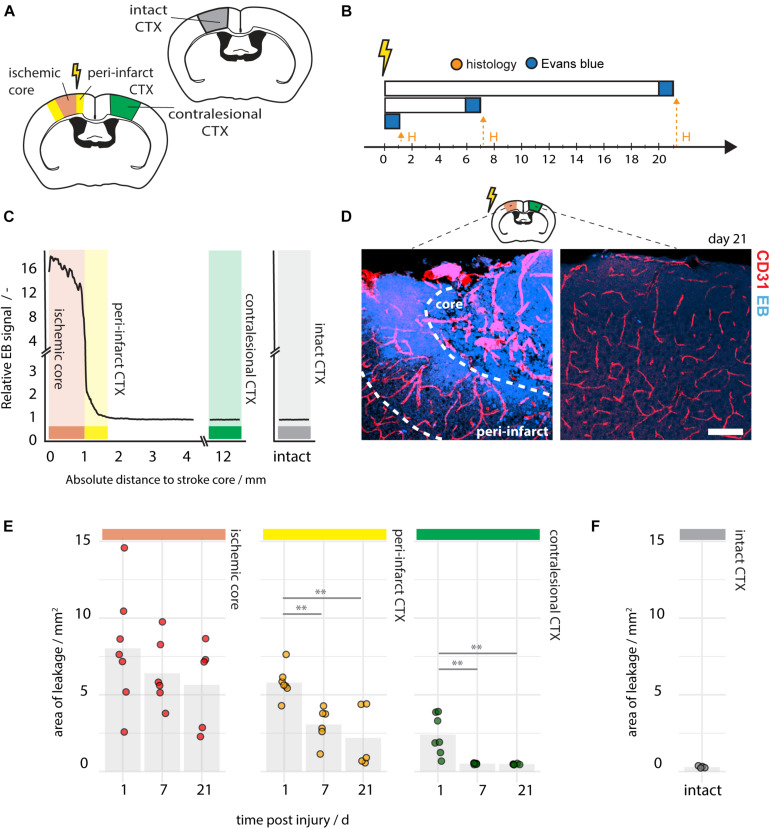
FIGURE 3.
Histological assessment of BBB permeability following photothrombotic stroke. (A) Schematic representation of region of interest within the ischemic core (red), the peri-infarct region (yellow), the contralesional cortex (green), and the intact cortex (gray). (B) Time course of the experimental pipeline of 1 day (N = 8), 7 days (N = 6), and 21 days (N = 5) following injury. (C) Spatial distribution of EB signal along the ischemic, contralesional and intact cortex at 21 dpi. (D) Representative images of EB signal in the peri-infarct and contralesional region at 21 dpi. Scale bar: 100 μm. (E) Quantification of EB -positive area of the stroke core, the peri-infarct cortex and the contralesional cortex at days 1, 7, and 21 post injury. (F) EB -positive area in intact mice (N = 4). Each dot in the plots represents one animal and significance of mean differences between the groups was assessed using unpaired two-tailed one-sample Student’s t-test. Asterisks indicate significance: ∗∗P < 0.01. Dpi, days post injury; H, histology; ctx, cortex; EB, Evans blue.

