Figure 2.

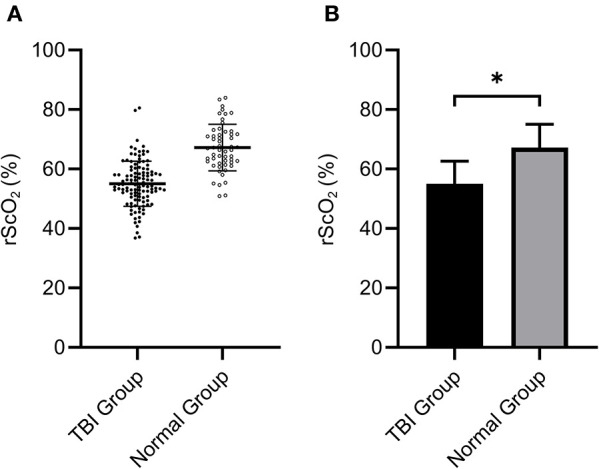
The rScO2 (55.06 ± 7.60)% of the TBI group was significantly lower than that of the normal group (67.21 ± 7.80)% (*P < 0.05). (A) Shows the distribution of data in two groups, (B) indicates the mean ± standard division.

The rScO2 (55.06 ± 7.60)% of the TBI group was significantly lower than that of the normal group (67.21 ± 7.80)% (*P < 0.05). (A) Shows the distribution of data in two groups, (B) indicates the mean ± standard division.