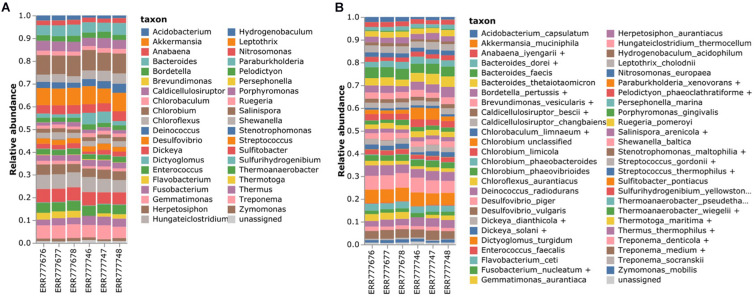
FIGURE 5.
Estimating the bacterial composition of the mock datasets. (A) Genus level and (B) species level profiling. Six mock samples were analyzed using the proposed 16S rRNA classification pipeline. The names of the species that were contained in the mock datasets were re-annotated according to the homologous species groups of the V3–V4 hypervariable region to compare the results.

