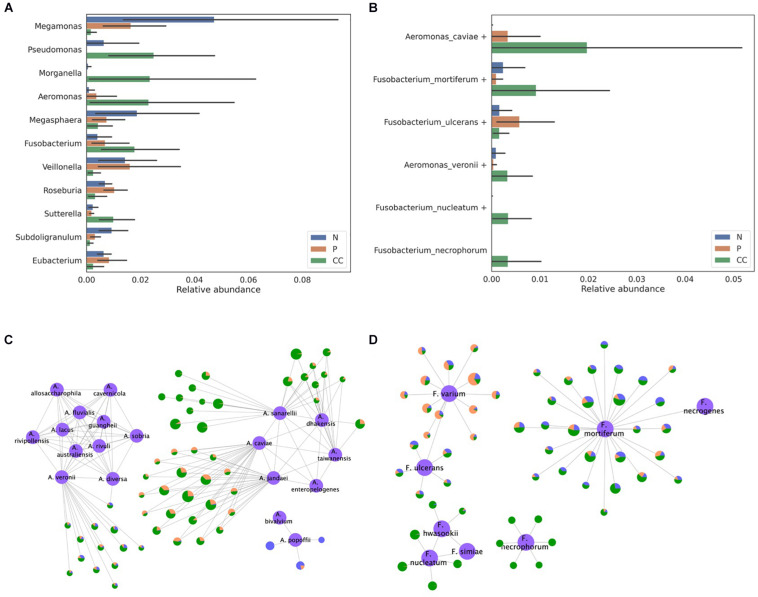
FIGURE 7.
Classification of the bacterial composition of gut microbiome samples obtained from the stool of control, adenoma, and cancer patients. (A) The relative abundance of the genera that were found to have an abundance more than three times that of the average relative abundance in at least one pair among the control, adenoma, and cancer groups and (B) the relative abundance of the species belonging to the Aeromonas and Fusobacterium genera are presented. The assignment results for the (C) Aeromonas and (D) Fusobacterium genera are represented by the network. The reference sequences are colored in purple and labeled using their species name. Each node except the reference node represents one out, and the bacterial composition of samples from each type of patient is plotted as a pie-chart (blue for control, orange for adenoma, and green for cancer). All OTUs are represented as being proportional to their log-scaled size.

