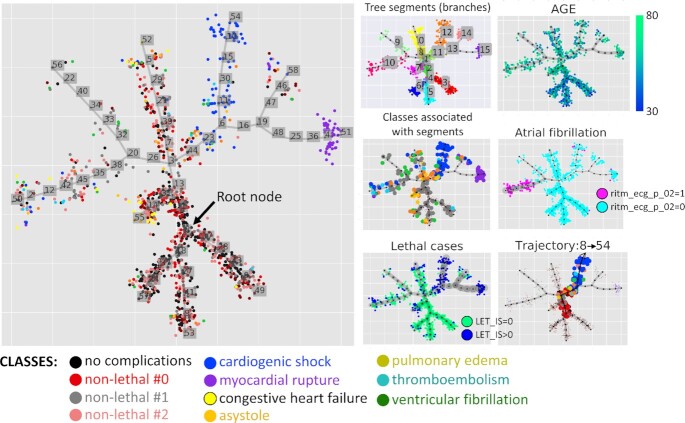
Figure 1.
Principal tree recapitulating the multidimensional structure of the myocardial infarction complications dataset. Distribution of classes along the tree is visualized in the large panel. Various modes of data visualization are shown in the small panels. “Tree segments (branches)" shows partitioning (clustering) of data points accordingly to the linear fragments connecting branching points and/or leaf nodes (called “non-branching segments" in this work). “AGE" is an example of a continuous variable visualization using color gradient of data points. “Classes associated with segments" shows data points of only those classes that have statistical associations with ≥1 segments. “Atrial fibrillation" and “Lethal cases" show visualization of a binary variable, with edge width reflecting the trend (in the case of “Lethal cases" it can be interpreted as lethality risk estimate). “Trajectory 8→54" is a subset of data points, colored according to their classes and belonging to 1 particular clinical trajectory, having the node with the least risk of complications as the root node (Node 8) and the highest risk of cardiogenic shock as its final state (Node 54).

