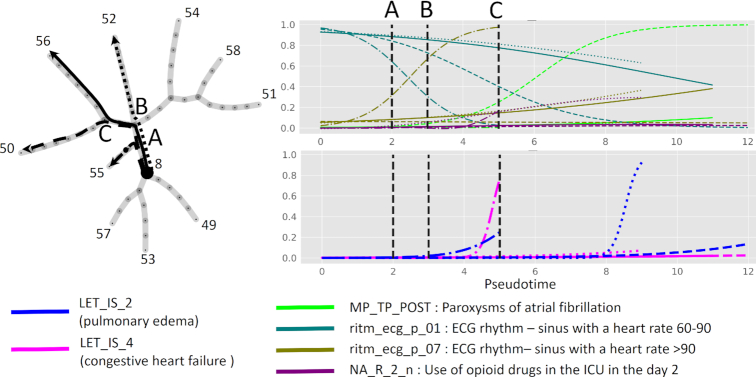
Figure 5.
Example of bifurcating clinical trajectories. Four of 10 clinical trajectories are depicted for myocardial infarction complications data. The trajectories all share the internal segment 8-A and diverge at nodes A, B, C. Four selected binary clinical variables and 2 lethal outcome variables are shown as functions of 4 pseudo-time measurements, 1 per trajectory. The abscissa in the pseudo-time plots corresponds to the variable value scaled to unity for the total variable amplitude.

