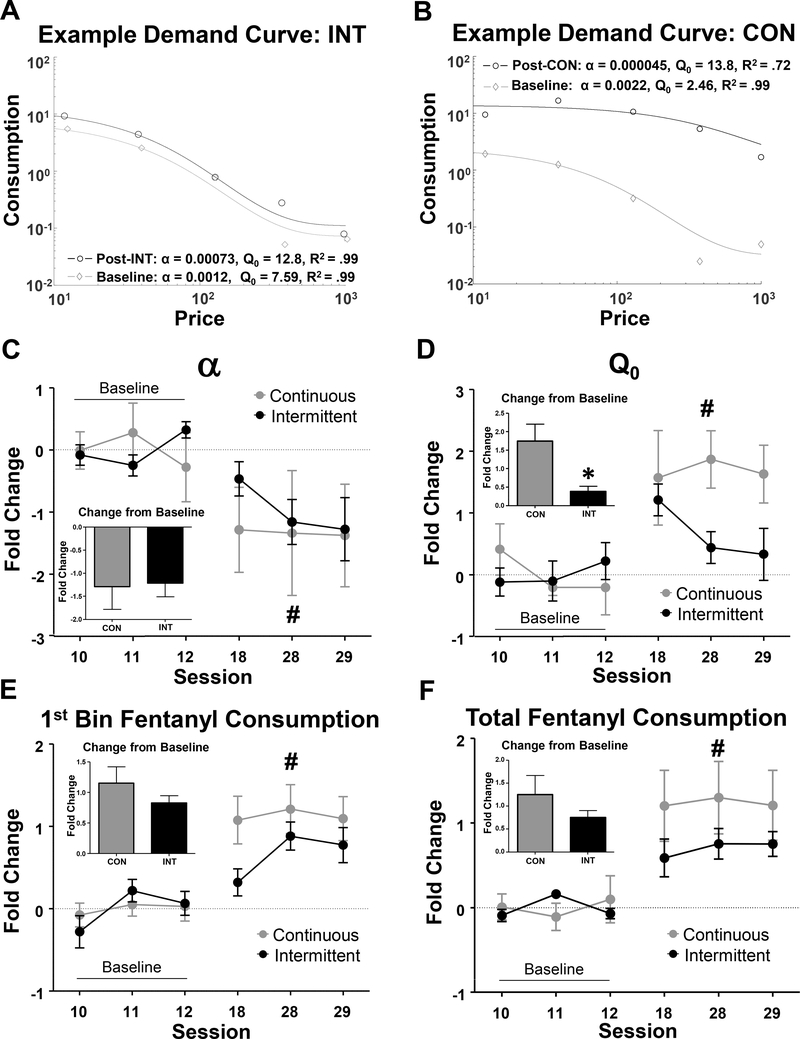
Figure 2:
Economic demand parameters from fentanyl demand sessions before and after CON vs INT access phase. A) Example pre- and post-INT access demand curve from a single rat. B) Example pre- and post CON access demand curve from a single rat. C-F) Log2 fold-change in indicated economic demand parameter across baseline (sessions 10–12) through post-schedule (sessions 18, 28–29) testing. Insets for each parameter show the average fold change from baseline (average of sessions 28–29 relative to average of three baseline sessions). ‘#’ indicates main effect of session, 2-way ANOVA. “*” indicates p<0.05 between CON/INT groups, 2-tailed t-test.

