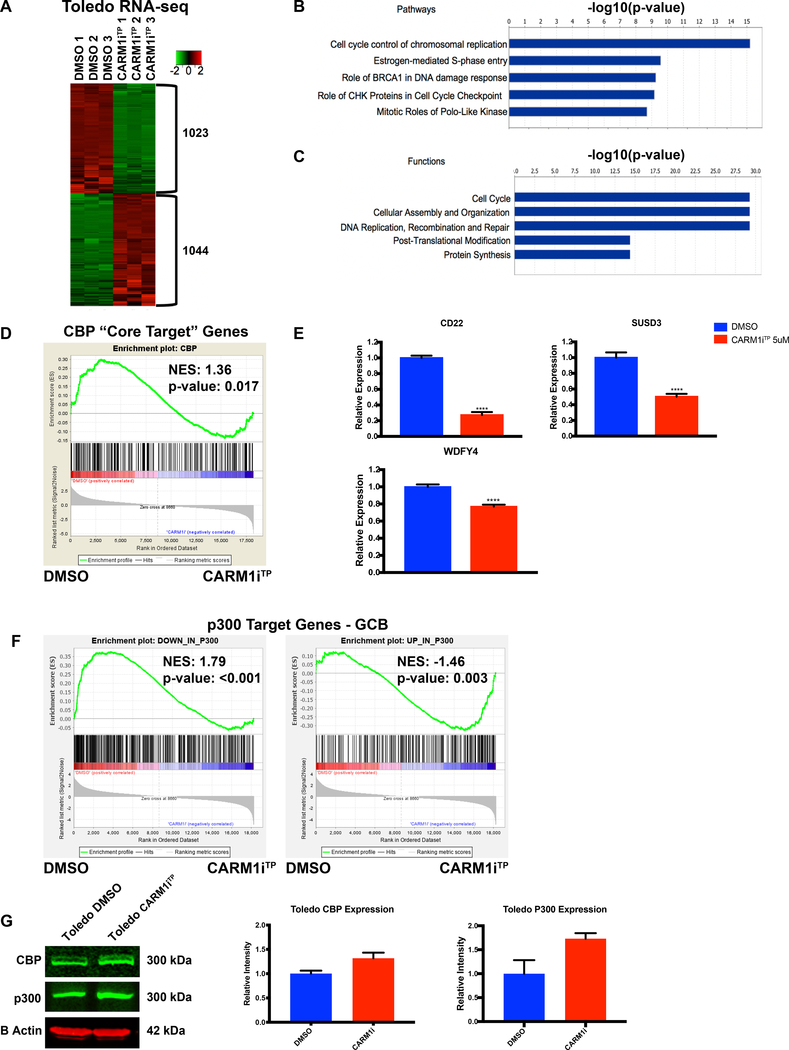
Figure 2. Transcriptional networks regulated by CARM1 activity in human DLBCL cells.
A) Heat map of genome-wide transcriptional changes in DMSO vs CARM1iTP-treated Toledo cells. Diagram shows three biological replicates. FC >/=2, FDR </= 0.05. B) IPA analysis of enriched pathways in the differential expression analysis. C) IPA analysis of enriched cellular functions in the differential expression analysis. D) GSEA plot evaluating transcriptional changes in CBP “core target” genes between DMSO and CARM1iTP-treated cells. CBP “core targets” are defined as genes bound by CBP in human germinal center B cells, and downregulated in CBP-deficient mouse BCLs. E) RT-qPCR confirmation of transcriptional changes in three CBP target genes shown to be significantly downregulated in the RNA-seq experiments. Statistical significance was calculated using unpaired t-tests. Error bars represent SEM, n=3. F) GSEA plot evaluating transcriptional changes in p300 target genes between DMSO and CARM1iTP-treated cells. Left panel shows downregulated p300 target genes, right panel shows upregulated p300 target genes. G) Western blot analysis and quantification of CBP and p300 protein expression levels in Toledo cells treated with DMSO or CARM1iTP. B-Actin was used as a loading control. Error bars indicate SD. N=2. All experiments were performed on the Toledo cell line, treated for 6 days with DMSO or 5uM of CARM1iTP. *p<0.05, **p<0.01, ***p<0.001, ****p<0.0001.

